

There are many beliefs about the role of CEO age in early-stage outcomes. Some think that great companies predominantly are started by eager young entrepreneurs that more compensate for their lack of experience with energy and non-traditional thinking. Others think that experienced CEOs achieve better outcomes. But what is myth and what is reality? In Part 1 of this data insight, we look for patterns of CEO age in investments and exits during 2025, based on data collected by ACA from 66 angel groups and over 1000 companies. In Part 2 next month, we will look at patterns in TCA Venture Group’s portfolio of 596 companies from 1997-2025 and the 321 Outcomes (Exits and Shutdowns) through 2025.
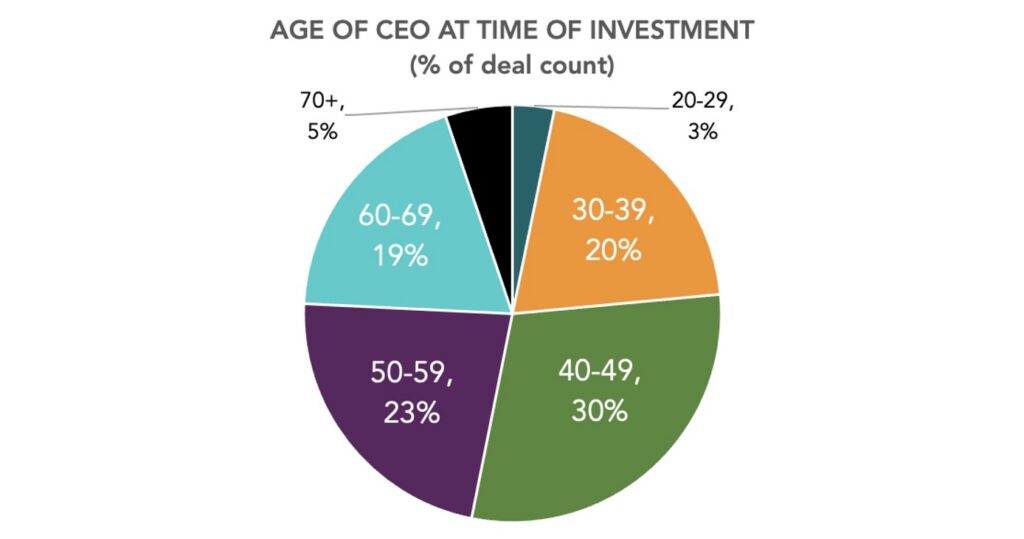
First, let’s look at the age distribution of CEOs that received funding. Figure 1 shows funded angel deals are most often in companies led by CEOs in mid-career or later-career stages. The largest cohort is 40–49, representing 30% of deals, followed by 50–59 at 23% and 30–39 at 20%. Taken together, CEOs ages 40–59 account for 53% of investments, while CEOs ages 40–69 represent 72%, indicating that angel investors are heavily backing CEOs with substantial professional experience, industry networks, and operating maturity.
Inversely, younger and older CEOs are much less common. CEOs ages 20–29 represent only 3% of investment deals, the lowest share in the dataset, while CEOs 70+ account for 5%. CEOs 60–69 represent a meaningful 19%, suggesting that angel-backed entrepreneurship remains active well beyond traditional mid-career years. The data indicate that CEO experience and domain credibility may remain important screening factors for angel investors, particularly in a more selective funding environment. These findings also challenge the common perception that successful entrepreneurs are typically young. While younger founders may account for a meaningful share of companies seeking funding, the data suggest that companies receiving funding tend to be led by older, more experienced entrepreneurs. In this context, age and experience appear to play an important role in funding outcomes.
Figure 1: More Than Half Of CEOs Are Ages 40-59
Source: Angel Capital 2026 Angel Funders Report
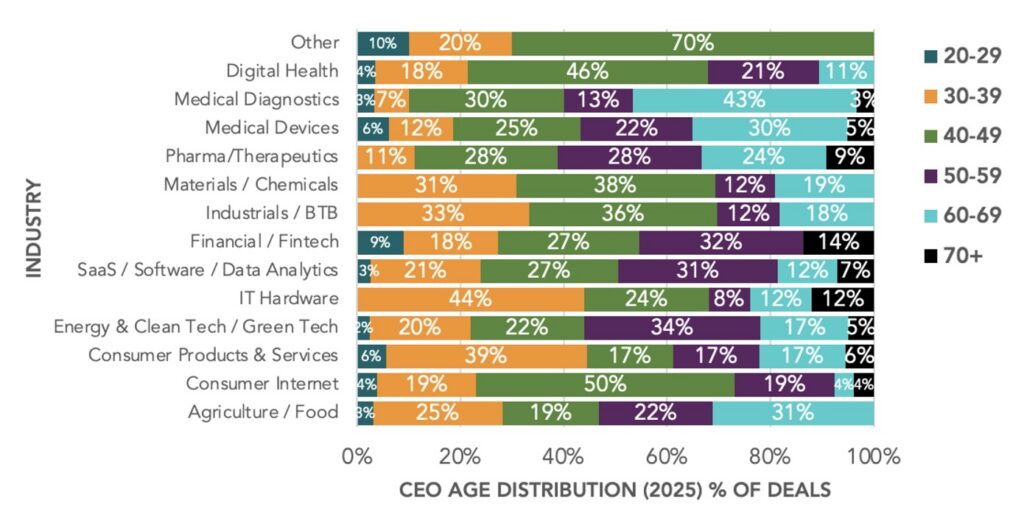
But what about the age patterns across different industry verticals? Figure 2 shows the 40–49 cohort is the dominant age band in many categories, including Consumer Internet at 50% of deals, Digital Health at 46%, Materials/Chemicals at 38%, Industrials/BTB at 36%, and Medical Diagnostics at 30%. Younger CEOs are most visible in sectors such as IT Hardware, where 44% of CEOs are ages 30–39, and Consumer Products & Services, where 39% are in that same age band.
By contrast, several science- and capital-intensive sectors skew older: CEOs ages 60–69 represent 43% of deals in Medical Diagnostics, 30% of Medical Devices, 31% of Agriculture/ Food, and 24% of Pharma/Therapeutics. CEOs under 30 remain uncommon across deals in nearly all sectors, generally in the low single digits, while CEOs 70+ appear most often in Financial/Fintech at 14%, IT Hardware at 12%, and Pharma/Therapeutics at 9%. Although this data set reflects only a 2025 cross-section and does not capture year-over-year change, it reinforces a clear investment pattern: angel investors appear to favor founders with substantial industry experience, particularly in regulated, technical, and life-science sectors where domain expertise and operating credibility are often essential to reaching commercialization milestones or where professional degrees or established medical careers need to be developed before entrepreneurial activity can start.
FIGURE 2. CEO Age Varies By Sector
Source: Angel Capital 2026 Angel Funders Report
What about the role of age in exits that return at least some capital? Figure 3 compares CEO age distributions for 2025 investment deals count and reported exit events. The age used for the exits, is the calculated age of CEO at the time of the first investment in the company rather than at the time of exit, to make the comparison meaningful. Exit events were concentrated in a narrower, mid-career founder band compared to new investment deals. CEOs ages 40–49 represented the largest share of 2025 investment deals at 30%, but an even larger 44% of exit companies, making this the dominant exit cohort. CEOs ages 30–39 also over- indexed in exits, accounting for 31% of reported exit events versus 20% of investment deals, while CEOs ages 50–59 were roughly proportional at 23% of deals and 25% of exits. By contrast, the youngest and oldest cohorts did not appear in reported 2025 exits: CEOs ages 20–29, 60–69, and 70+ together represented 27% of investment deals, but 0% of exit events. The analysis points to a notable difference between the age distribution of funded and exited companies. While angel investments are broadly distributed across older CEO age groups, companies achieving exits are disproportionately concentrated among CEOs who were ages 30–49 at the time of the first reported investment. Although the cross-sectional nature of the data prevents causal interpretation, the pattern may indicate that CEO age—and the balance between experience, execution capability, and growth horizon—plays an important role in commercialization and exit outcomes.
Figure 4. Sweet Spot For Exit Returns Are CEOs Aged 40-49 At Time Of Exit
Source: Angel Capital 2026 Angel Funders Report
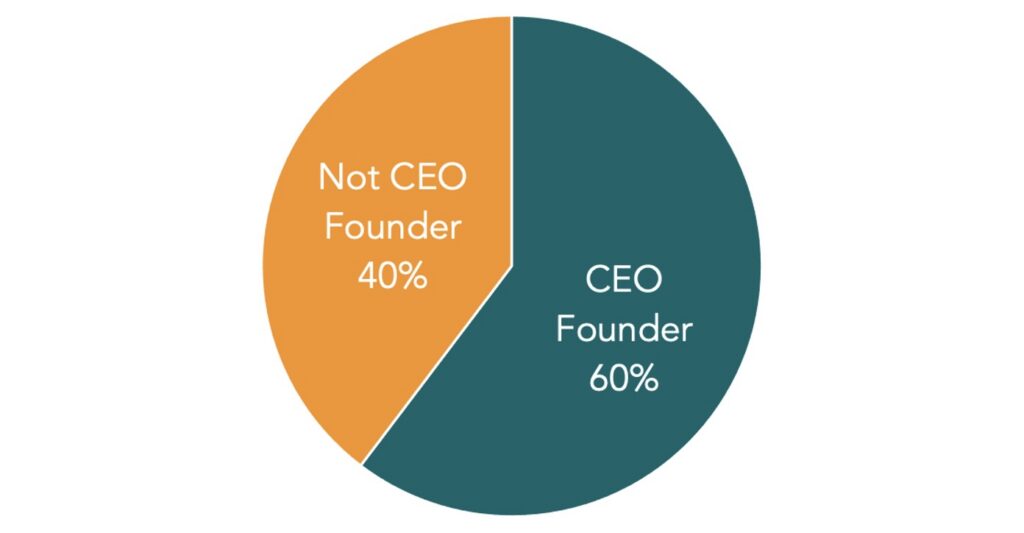
For the exits, how many still had the original founder in the CEO role at time of exit? Figure 5 shows that founder-led companies represented a majority of the reported 2025 exit events, with the original founder still serving as CEO in 60% of exits. The remaining 40% of exits occurred after a non-founder CEO was in place, indicating that leadership transitions are also common on the path to liquidity. In 2025, continuity is an important feature of successful angel-backed exits, while professionalized or successor leadership changes can also produce meaningful outcomes. Looking forward, investors should evaluate CEO performance as part of the broader company-building trajectory: retaining a founder CEO may preserve vision and mission alignment, but leadership evolution can be equally important when the company’s stage, market complexity, or exit path requires different operating capabilities.
Figure 5. 60% Of Reported Exit Events Have Original Founder as Ceo
Source: Angel Capital 2026 Angel Funders Report
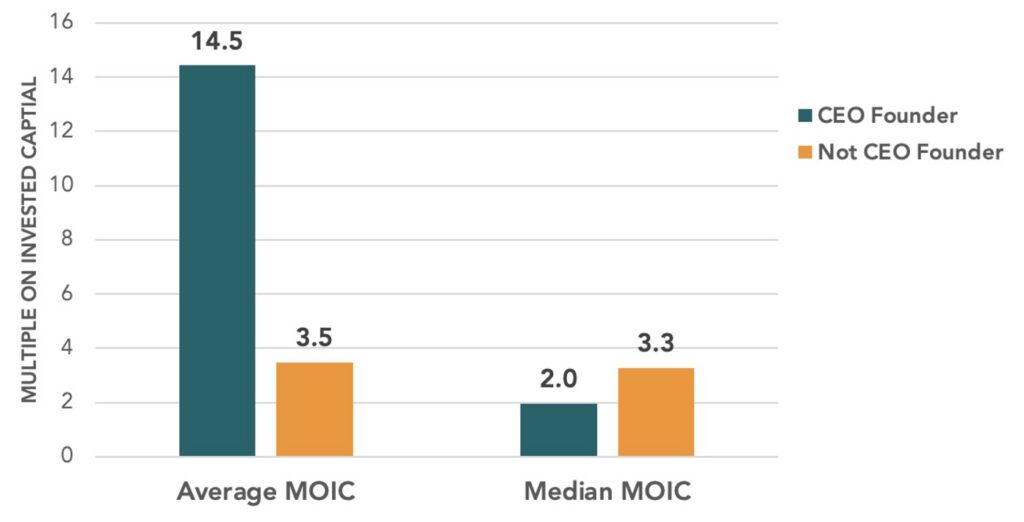
Do founders who remain as CEO through exit produce better outcomes? The answer is mixed. Figure 6 shows a clear contrast between average and median exit performance based on whether the CEO at the time of exit was the original founder. Founder-led exits produced a much higher average MOIC of 14.5x, compared with 3.5x for exit events in companies led by non-founder CEOs, indicating that founder-led companies accounted for the largest outlier returns. However, looking into the data set, this is largely driven by a single “home run” exit led by a founder. The median tells a different story. Non-founder CEO exits generated a higher median MOIC of 3.3x, versus 2.0x for founder-led exits. This gap suggests that while founder-led companies may be more likely to produce exceptional upside, non-founder-led exits delivered stronger typical outcomes in the reported 2025 exit set. Since portfolio returns depend on a few outsized home runs, companies retaining their founder may be contributing more to the overall portfolio return. Looking forward, investors should evaluate founder leadership and professional CEO transitions as different but potentially complementary paths to liquidity: founder CEOs may preserve the vision that drives breakout returns, while non-founder CEOs may improve execution consistency and median exit performance as companies mature.
Figure 6. Home Run Founder Led Exit Drives Up Average Moic
Source: Angel Capital 2026 Angel Funders Report
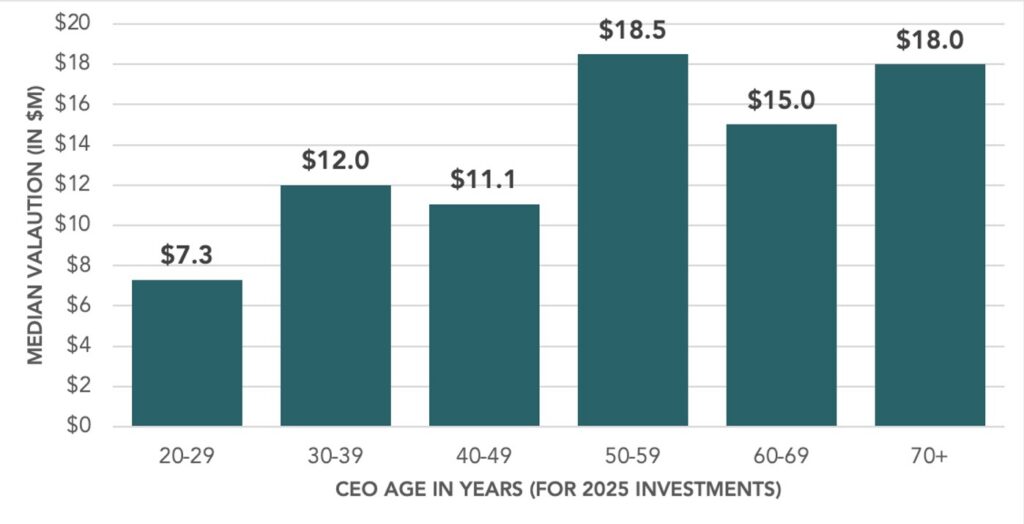
How does CEO age influence valuation? Figure 7 shows that median valuation generally rises with CEO age, suggesting that investors place a meaningful premium on executive experience, industry credibility, and operating track record. The lowest median valuation was for CEOs ages 20–29, at $7.3M, while the highest was for CEOs ages 50–59, at $18.5M. CEOs 70+ were close behind at $18.0M, and CEOs ages 60–69 also commanded a strong median of $15.0M. By comparison, the two middle-younger cohorts were lower, with CEOs ages 30–39 at $12.0M and ages 40–49 at $11.1M. The spread is material: companies led by CEOs ages 50–59 had a median valuation more than 2.5x that of companies led by CEOs under 30. In 2025 angel investors backed founders across age groups, yet valuation support appears strongest for later-career CEOs. The data indicates that investors may continue assigning valuation premiums to founders who bring deeper domain expertise, leadership history, and execution credibility. However, it is also possible that given the high level of CEO continuity among angel backed companies, the higher valuations are more highly correlated with company stage than CEO age independently as later-stage companies command higher valuations.
Figure 7. Valuations Higher For Older CEOs
Source: Angel Capital 2026 Angel Funders Report
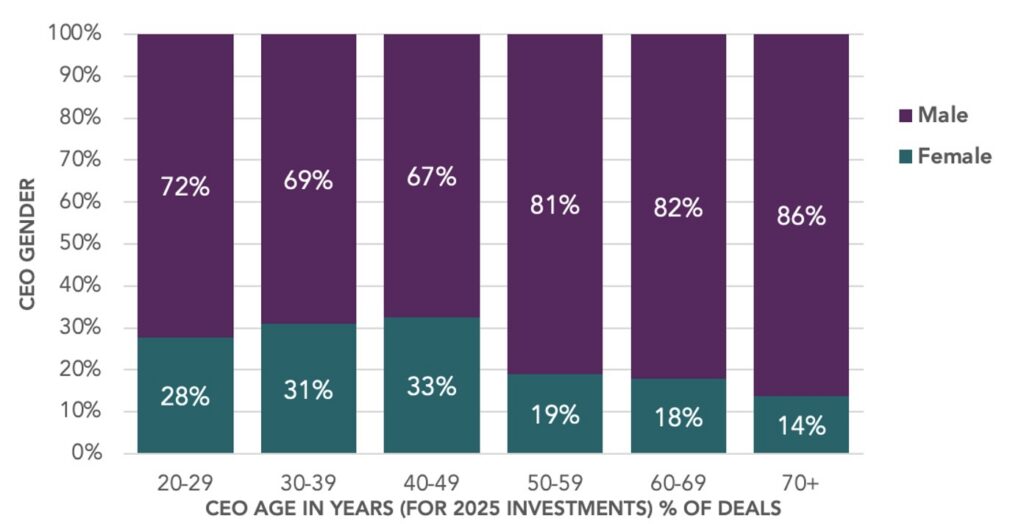
How does gender mix change by age cohort? Figure 8 shows that female CEO representation is strongest among younger and mid-career angel-backed founders compared to older age cohorts. Looking at reported deal with CEOs between the ages of 20-29, 28% were female-led companies. In comparison, 31% of deals with CEOs aged 30–39, and peak at 33% among CEOs ages 40–49. After that point, representation is lower: female CEOs account for only 19% of the deals with CEOs between 50–59, 18% of 60–69, and 14% of CEOs 70+. Inversely, male CEO representation rises from 67% in the 40–49 cohort to 86% among CEOs 70 and older.
Figure 8. Younger Female CEOs More Common Below Age Of 50
Source: Angel Capital 2026 Angel Funders Report
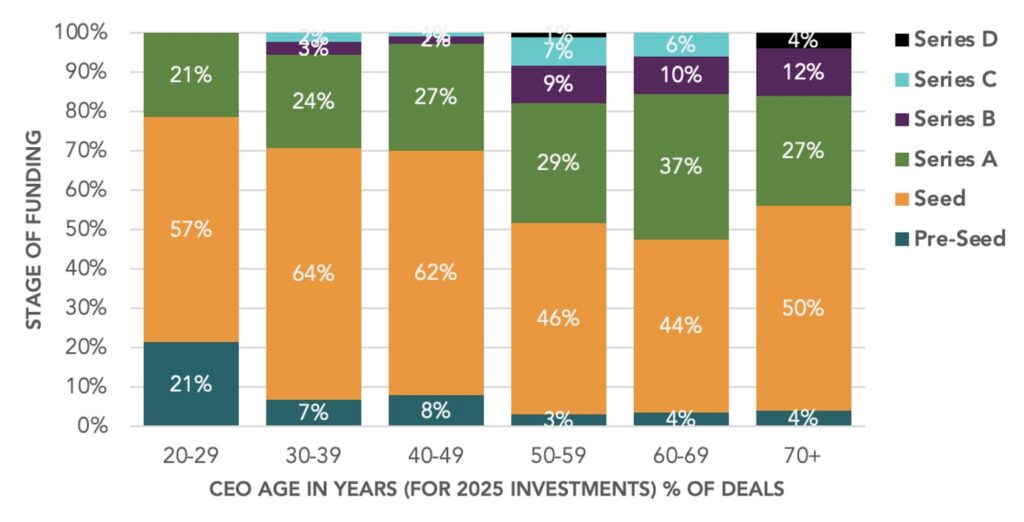
How does CEO age vary across the development stages of companies? Figure 9 shows that Seed-stage investing dominates across every CEO age cohort in 2025, but the stage mix becomes more mature as CEO age increases. Seed represents the largest share for all groups, peaking at 64% for CEOs ages 30–39 and remaining high at 62% for ages 40–49, before declining to 46% for ages 50–59 and 44% for ages 60–69. The youngest CEOs show the strongest Pre-Seed skew: CEOs ages 20–29 had 21% of funding at Pre-Seed, compared with only 3%–8% across most older cohorts. Later-stage deals make up a larger percentage among older CEOs, with Series B and later rounds concentrated most heavily in the 50+ cohorts. CEOs ages 60–69 had the highest Series A share at 37%, while CEOs 70+ showed a meaningful 12% Series B share and 4% Series D share. In 2025, deals lead by younger founders are more often formation stage, while deals led by older CEOs are more likely to be in companies that have advanced further through the financing lifecycle. These findings suggest that CEO age should be evaluated alongside company stage, since later-career leadership is more commonly associated with companies that are further advanced in the financing lifecycle.
Figure 9. Deals With Young CEOs Are Proportionally More Early Stages
Source: Angel Capital 2026 Angel Funders Report
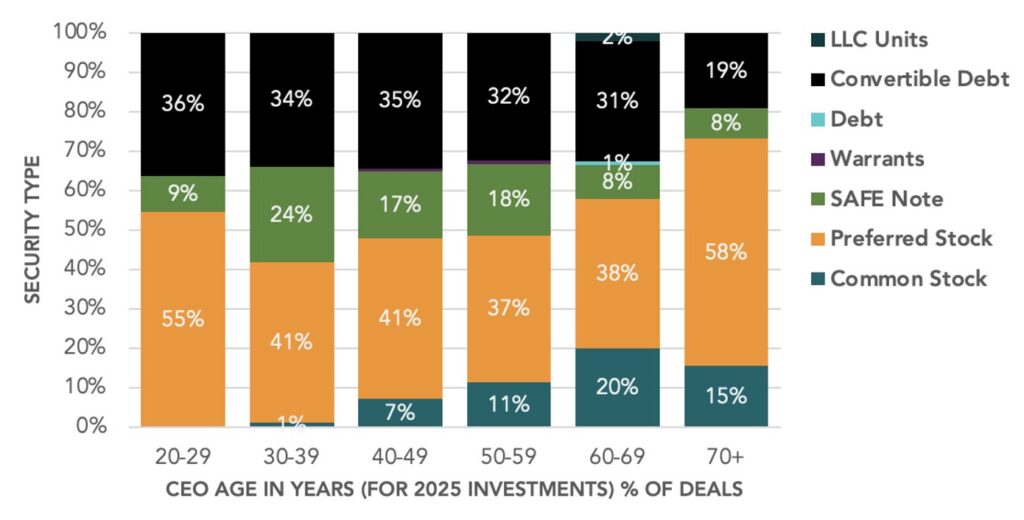
Are certain investment structures more common in specific age groups? Figure 10 compares investment structure of reported deals by CEO age and shows that preferred stock remains the leading security across every age cohort, but the mix varies meaningfully. Preferred stock is highest among deals led by CEOs 70+ at 58% and 20–29 at 55%, while it is less dominant among CEOs 50–59 at 37% and 60–69 at 38%. Convertible debt is broadly used across most cohorts, ranging from 31% to 36% for CEOs under 70, before dropping to 19% for CEOs 70+. SAFEs are proportionally most prevalent among deals led by CEOs in the middle age groups of 30–39 at 24%, 40-49 at 17%, and 50-59 at 18%. In contrast, the deals led by the youngest CEOs, aged 20-29, and oldest CEOs, aged 70+ have the smallest proportion of SAFE notes with 9% and 8% respectively. Perhaps the lower proportional prevalence of SAFE notes in deals led by CEOs at age extremes is a reflection of greater investor negotiating power. Common stock, by contrast, becomes more visible in later-career cohorts, rising from nearly absent among younger CEOs to 20% for CEOs 60–69 and 15% for CEOs 70+. The 2025 pattern suggests that security choice reflects a combination of company stage, founder profile, and deal context rather than CEO age alone. Looking forward, investors should expect preferred stock and convertible debt to remain core structures, while SAFEs remain proportionally more common in deals led by mid-aged-founders and earlier-stage financings while common stock appears more frequently in select later-career or company-specific transactions.
Figure 10. SAFEs Proportionally Less Common In Deals Led By The Oldest & Youngest CEOs
Source: Angel Capital 2026 Angel Funders Report
All of the above analysis is based on a robust data set in a specific year (2025). But what if we broaden that to the last 28 years, and include all outcomes (exits and shutdowns)? Unfortunately, ACA has not collected that longer data, but TCA Venture Group does, and so next month we will present that analysis of TCA VG’s portfolio and provide some insights based on the longer period in Part 2 of this series.
Key Takeaways
- Angel-backed CEOs skew older than the startup stereotype: Deals funded in 2025 were in companies that were more likely to be led by experienced, mid-career and later-career CEOs, not by very young founders. The data suggest that angel investors are placing substantial weight on operating experience, domain credibility, and leadership maturity.
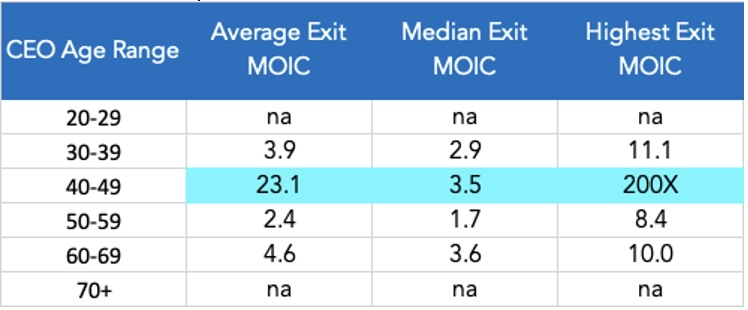
- Return performance is strongest in the 40–49 and 60–69 cohorts — MOIC data show that the best exit outcomes were not evenly distributed by CEO age. Reported exits with CEOs aged 40–49 produced the highest average MOIC at 23x, driven in part by a major 200x home run, while still posting a strong 3.5x median. But deals led by CEOs aged 60–69 had the highest median MOIC at 3.6x, with a 4.6x average, suggesting that later-career experience can translate into strong outcomes without relying entirely on a single home run. The pattern suggests that experience matters, but not in a simple linear way.
- Valuation premiums rise with CEO age and experience — Median valuations were lowest for reported deals with CEOs aged 20–29 and highest for CEOs ages 50–59. Prior CEO experience also rises with age: only 11% of CEOs ages 20–29 had prior CEO experience, compared with 49% of CEOs ages 50–59 and 57% of CEOs ages 60–69. Overall, 64% of deals funded had first time CEOs, but the valuation data suggest that investors apply a premium to later-career founders who bring deeper operating and sector experience.
- Age intersects with gender, sector, and company stage — Female CEO representation was highest in the younger and mid-career cohorts. CEO age in 2025 angel-backed investments varies meaningfully by sector. Several science- and capital-intensive sectors skew older: CEOs ages 60– 69 represent 43% of deals in Medical Diagnostics, 30% of Medical Devices, 31% of Agriculture/ Food, and 24% of Pharma/Therapeutics. While younger CEOs are most visible in sectors such as IT Hardware, where 44% of CEOs are ages 30–39, and Consumer Products & Services, where 39% are in that same age band.
Looking forward, while angel investors should avoid treating age as a standalone predictor, the data from Part1 of this series indicate that founder age often serves as a proxy for domain expertise, prior leadership experience, sector fit, and stage readiness—all increasingly important in a selective funding environment.
AUTHOR
John Harbison, Chair Emeritus of TCA Venture Group and ACA Data Analytics Committee Chair