
Author’s Note
This report was prepared independently by Athan Gousios and does not represent the views, findings, or investment recommendations of any angel group or other organization. The source organization has been intentionally anonymized, and no portfolio company names, founder names, individual investment amounts, or other company-identifying information are disclosed.
The study uses historical data spanning 2015–2020. Data from 2015–2017 were used exclusively for model development and training, while 2018–2020 were reserved for out-of-sample testing and constitute the investment vintages for which portfolio results are reported. All results are presented in aggregated or anonymized form, and the underlying confidential data are not reproduced or distributed through this report.
The Big Question
Can information available at the time of an angel investment be systematically used to improve portfolio outcomes? Our results suggest that it can.
Using more than 300 historical companies to construct a quantitative factor model, we put this factor model to the test and collected the results. Across the out-of-sample vintages tested, the model showed promising evidence of value in company selection, downside avoidance, opportunity filtering, and capital allocation. This report will highlight these findings, including:
- Higher factor scores were associated with dramatically lower failure rates. In the 2018 cohort, companies scoring below 4 experienced a 32.3% write-off rate, while none of the 11 companies scoring 4 or higher were written off.
- Factor-based selection materially improved portfolio outcomes. In the initial 2018 out-of-sample test, the top-scoring portfolio ranked in the 94th percentile of 10,000 randomly generated portfolios, compared with approximately the 52nd percentile for the group’s actual portfolio.
- Simply removing the weakest-scoring opportunities improved the odds. Filtering out companies scoring below 2 increased median simulated portfolio MoIC from 5.25x to 6.03x, while reducing the probability of a sub-3x portfolio from 7.0% to 1.9%.
- The model showed value beyond company selection. The score-weighted “Blunderbuss” Portfolio maintained exposure to every company while concentrating capital in higher-scoring opportunities. In 2018, it produced a 7.38x MoIC, versus 5.25x for the median random portfolio.
- The signal persisted across additional vintages. Across 2018–2020, the top-score strategy produced a 4.6x average annual vintage MoIC, compared with 3.64x for the group’s actual portfolios and 3.3x for the median random portfolios. The Blunderbuss strategy produced 4.27x while retaining exposure to the entire opportunity set.
The implication is simple: angel investing may be too dependent on intuition alone. Historical investment data can provide a quantitative counterweight, helping investors identify stronger opportunities, avoid weaker ones, and allocate capital more systematically and effectively.
Fitting the Quantitative Framework to the Angel Asset Class
As angel investing attracts more capital and increasingly more sophisticated data collection, a natural question follows: can quantitative methods improve how investors select and size early-stage investments? Thus, we began to design and test a portfolio model built solely with systematic and quantitative screening criteria, and test the resulting portfolio against both the average (median) portfolio, as well as the selected angel group’s overall portfolio allocation for that specific year.
Unlike public markets, which have access to extensive standardized financial, pricing, and market data that can be used to guide investment strategies, we are much more limited in what we have access to as angel investors. Early-stage companies often lack long operating histories, standardized financial metrics, and continuously observable market prices. We therefore had to choose and design our model carefully around the information that is available during the angel screening and investment process. After significant workshopping, a factor model was chosen to test this hypothesis.
Factor models have been used for decades in public markets to test whether measurable characteristics are systematically associated with differences in investment returns. Beginning with the Capital Asset Pricing Model, and later expanding through the work of Fama and French, Carhart, and others, modern factor investing evolved from a single market-risk framework into models incorporating characteristics such as size, value, momentum, profitability, and quality. Quantitative firms including AQR and Dimensional Fund Advisors later helped bring factor-based approaches into institutional investment practice. Factor models have continued to evolve and today can incorporate a wide range of measurable characteristics, provided those characteristics can be defined consistently and tested against subsequent outcomes. Because of this built-in flexibility, along with their largely fundamental inputs, factor models emerged as a natural framework for applying quantitative investment strategies to the angel space. Factor models do not inherently rely on daily pricing, can be driven largely by the underlying dynamics and characteristics of a business, and are well suited to evaluating outcomes over longer timeframes, the latter of which seems to be a requirement for generating material outperformance in angel investing.
While angel investing presents a very different dataset than public markets, the underlying question is similar: do observable company characteristics contain repeatable information about subsequent outcomes?
Our central hypothesis is that company characteristics observable during the angel investment process contain measurable predictive information, and that a quantitative factor model built from these signals can be used to improve both investment selection and portfolio allocation.
We will test this hypothesis in two ways. First, we examine whether higher factor scores are associated with stronger subsequent investment outcomes, including higher returns and lower write-off rates. Second, we will test whether portfolios constructed or weighted using those factor scores outperform randomly generated portfolios and the angel group’s actual historical portfolio allocation.
Designing the Study
Within the angel group we chose for this case study, we found there was a repeatable series of events built into the sourcing and screening process:
- Initial contact with potential investment
- Screening round
- Invitation to present to angel investors
- Decision to invest
After passing the initial screening round and being invited by the screening council to present at the main meeting, companies are required to provide an overview document that includes a specific set of information and follows a uniform format. All companies presenting follow the same overview document structure. Because the overview document was created before the investment decision and followed a consistent format across presenting companies, it provided a standardized source of contemporaneous information for the model. We chose to use this overview document as the input for our factor screening.
Crucial to any reputable investment hypothesis, we sought to avoid hindsight bias, curve-fitting, or any other form of look-behind cherry-picking that would make our model appear better on paper than it is in practice. Thus, we landed on the following approach: a system designed using companies from 2015 through 2017 (three years, 300+ companies) and then tested on companies from 2018 and beyond.
Think of it as a system designed using only information available as of December 31st, 2017, and then applied to investments beginning January 1st, 2018. This “walk-forward” methodology provides us with an out-of-sample dataset and allows us to test whether the screening process can identify meaningful predictive signal in data it has never seen before.
Finding the Right Factors
Factor models can be built using almost anything, which is often both their advantage and their detriment. Nothing is off limits, in theory: CEO hair color, company size, patent data, founder prior experience, etc. Because of this flexibility, the challenge is not simply finding factors to test, but finding factors that show meaningful predictive edge while also providing useful insight into the underlying company.
We tested more than 35 potential factors for their relationship to investment outcomes, and ultimately whittled the model down to the factors that showed the strongest and most consistent predictive value. Each factor was analyzed based on whether it was present in a company and how companies possessing that characteristic ultimately performed. This allowed us to compare the frequency of each factor across stronger and weaker outcomes and determine whether its presence was meaningfully associated with subsequent MoIC or failure rates.
Several illustrative examples of signals used in the system include:
- clearly articulated exit pathways
- credible go-to-market strategies
- proprietary data assets or defensible product positioning
Likewise, examples of signals with limited or negative predictive power include:
- large corporate founder backgrounds
- patents
These examples highlight an important insight from the analysis: some traits commonly perceived as strengths in venture investing did not consistently correlate with stronger outcomes in the group’s dataset, while other, less obvious characteristics showed much stronger relationships with performance.
Each retained factor was then given a specific weighting based on the strength and consistency of its relationship with company outcomes. Among the retained factors, those showing weaker predictive relationships received smaller weights, while factors demonstrating stronger relationships with positive or negative outcomes received larger weights. The goal was not to reward characteristics that sounded intuitively attractive, but to allow the historical data to determine which characteristics mattered most.
The final predictive score represents a weighted combination of individual signals and interaction signals. Higher scores indicate stronger alignment with characteristics historically associated with successful investments. The full factor set, individual factor scores, weighting methodology, interaction logic, and company-level scoring outputs are not disclosed in this report.
Once we determined which factors were most important to measure and which showed the strongest signs of predictive power, we were ready to begin testing the model on the “future” companies from 2018 and beyond.
Walk-Forward: Testing the Model
With the rules firmly established, we can now begin testing the model. All companies from 2018 were scored based on the standardized overview information available prior to the investment decision. Scores were determined by adding the individual factor scores for each company, producing a total score ranging from -3 to +8 depending on which characteristics were observed.
To compare the model against random selection, we ran a 10,000-pass Monte Carlo simulation of random 18-company portfolios, matching the 18 investments made by the angel group that year. We then selected the top 18 companies by factor score and compared the resulting portfolio against both the angel group’s actual 2018 portfolio and the distribution of randomly generated portfolios.
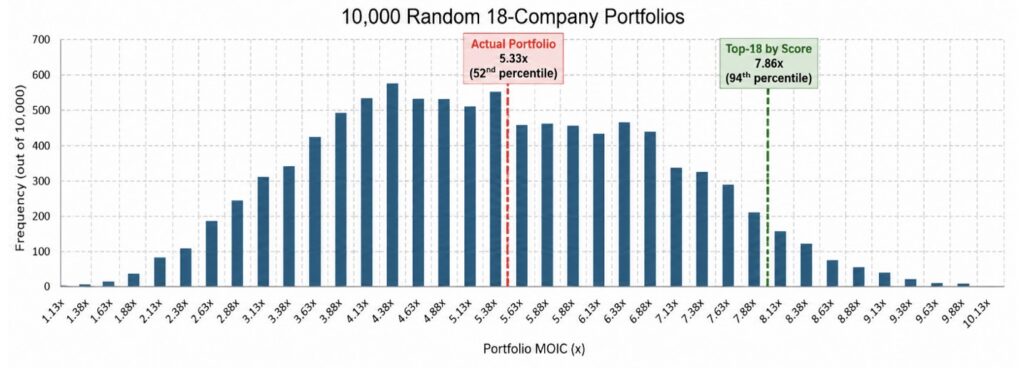
Under equal allocation, the predictive system produced materially higher returns than both the group’s actual investment portfolio and randomly generated portfolios.
In percentile terms:
- Actual portfolio: 51.8th percentile
- Top-score portfolio: 93.6th percentile
These results indicate that the predictive system generated substantial outperformance relative to both the group’s selections and random allocation.
Factor Scoring as Risk Reduction
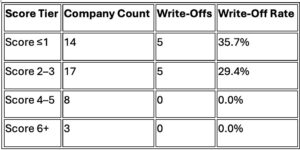
Beyond identifying high-return investments, the system also demonstrated a strong relationship between factor score and downside risk. In the 2018 cohort, all 10 observed write-offs occurred among companies receiving factor scores below 4. No company scoring 4 or higher was written off.
Write-off rates by score tier were as follows:
When grouped into a simple binary filter:
- Score <4: 10 of 31 companies written off — 32.3% write-off rate
- Score ≥4: 0 of 11 companies written off — 0.0% write-off rate
The predictive signals therefore appear to function not only as a winner-selection tool, but also as a potential downside-risk filter. In the 2018 holdout cohort, every observed write-off occurred among companies scoring below 4, while none of the 11 companies scoring 4 or higher was written off.
Using Factor Scores to Filter the Opportunity Set
Beyond selecting only the highest-scoring companies, we also sought to test whether the factor model could improve outcomes simply by removing the weakest opportunities from consideration. To test this, we ran two separate 10,000-pass Monte Carlo simulations of 18-company portfolios. The first randomly selected from the full 2018 company universe, while the second selected only from companies receiving a factor score of 2 or higher.
The graph below compares the resulting distributions of portfolio MoIC. Rather than focusing on a single portfolio outcome, this analysis allows us to see how applying a basic factor-score filter changes the entire range of potential portfolio results.
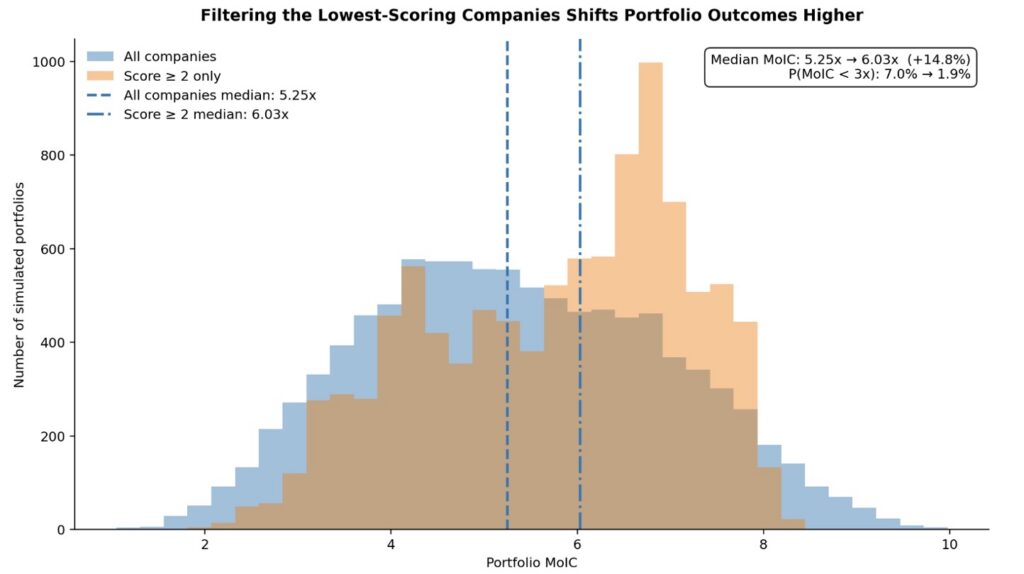
Filtering out companies scoring below 2 increased median portfolio MoIC from 5.25x to 6.03x, an improvement of approximately 14.8%. At the same time, the probability of producing a portfolio below 3x fell from 7.0% to 1.9%. The distribution visibly shifts toward stronger outcomes, suggesting that the factor model may create value not only by identifying the very best companies, but also by systematically removing weaker opportunities and improving the overall quality of the investable universe.
Using Factor Scores to Determine Allocation Sizing: The Blunderbuss Portfolio
The factor model also provides interesting utility when applied to position sizing, and helps us answer a different portfolio-construction question: can we maintain exposure to EVERY opportunity while still allocating capital more efficiently? We found that the answer was yes.
Rather than using the factor score solely to decide which companies to invest in, we used it to determine how much capital each company should receive. Every company in the opportunity set receives an allocation; only the size of that allocation varies. Thus, the “Blunderbuss Portfolio” was born. The rules for allocation are as follows:
- Allocation = score x base allocation
A company with a score of 8 receives 8x the base allocation, while a company with a score of 3 receives 3x. Companies scoring 0 or below still receive a small 0.25x allocation. This allows the portfolio to maintain exposure to every opportunity, including potential outliers that the model may underestimate, while committing substantially less capital to companies with weaker predicted outcomes. The results are shown below:
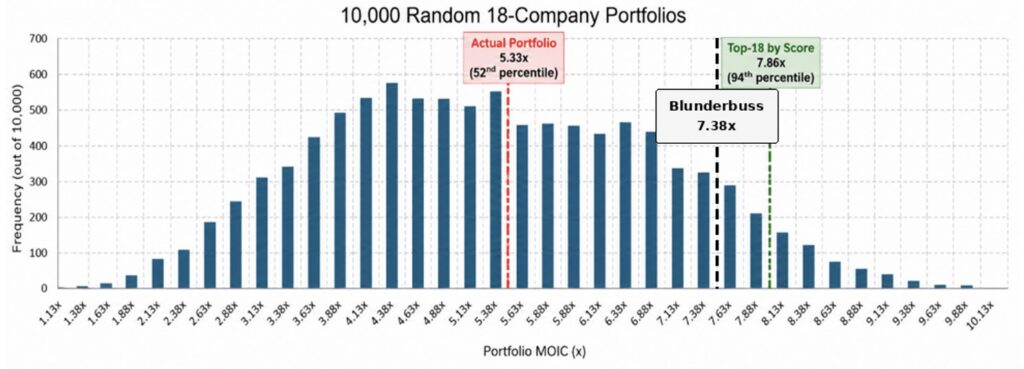
The Blunderbuss portfolio produced a 7.38x MoIC, compared with 5.33x for the group’s actual allocation and 5.25x for the median randomly generated portfolio. Relative to the Monte Carlo median, this represents an approximately 41% improvement in MoIC. Most importantly, the strategy achieved this improvement without eliminating exposure to any company in the opportunity set. Exposure to every single opportunity was achieved, while still shading the odds in favor of higher returns.
Does the Predictive Signal Persist?
The 2018 results provide an encouraging initial out-of-sample test, but a useful predictive system should not depend on the outcome of a single investment vintage. We therefore continued applying the same factor framework to subsequent cohorts, using the information available at the time each company entered the investment process. When applying the same walk-forward framework to the 2019 cohort, the results remained encouraging:
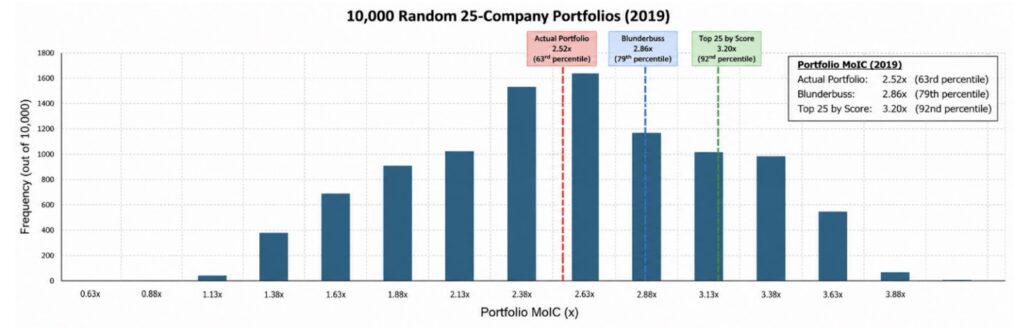
The actual 2019 portfolio produced a 2.52x MoIC, one of the weaker performances by vintage in the dataset. By comparison, the Blunderbuss portfolio produced a 2.86x MoIC, while the top 25 companies by factor score produced a 3.20x MoIC. Relative to 10,000 randomly generated 25-company portfolios, the Blunderbuss strategy ranked near the 79th percentile and the top-score portfolio near the 92nd percentile. The predictive signal therefore continued to show value in a second out-of-sample vintage.
Testing further into the 2020 vintage produced a somewhat different result:
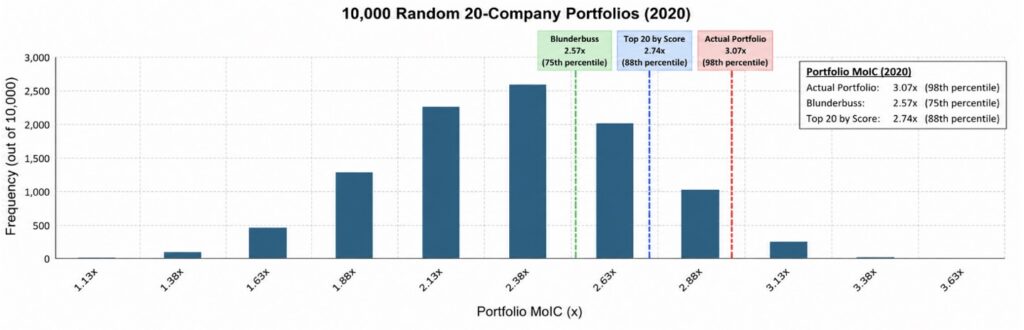
The group’s actual 2020 portfolio performed exceptionally well, producing a 3.07x MoIC and ranking near the 98th percentile of randomly generated portfolios. The factor-based portfolios did not outperform the group’s actual allocation that year. However, both remained well above the random baseline: the Blunderbuss portfolio produced a 2.57x MoIC, ranking near the 74th percentile, while the top 20 companies by score produced a 2.74x MoIC, ranking near the 86th percentile.
Taken together, the 2019 and 2020 results suggest that the predictive signal was not isolated to the initial 2018 test. The model did not outperform the angel group in every subsequent vintage, but factor-based selection and allocation continued to produce portfolios that ranked materially above random selection. This is an important distinction: the purpose of the model is not to perfectly predict every outcome, but to systematically improve the odds of constructing stronger portfolios over longer periods of time.
Across the three-year period, the factor model produced an average annual vintage MoIC of 4.6x, compared with a 3.3x median random-portfolio MoIC and a 3.64x average annual vintage MoIC for the group’s actual allocation. The Blunderbuss portfolio achieved an average annual vintage MoIC of 4.27x, while maintaining exposure to every single company in the dataset. These three-year figures represent the simple arithmetic mean of the annual MoICs for 2018, 2019, and 2020; they are not weighted by the amount of capital invested in each vintage and should therefore be interpreted as averages of annual portfolio outcomes rather than aggregate returns on all capital invested across the full period.
Implications for the Angel Investing Landscape
The above research is not intended to act as a replacement for due diligence, nor as an end-all-be-all to the decision-making process. However, the results suggest that angel groups may benefit from adding a quantitative screening layer to their existing diligence processes. Both factor-based selection and allocation outperformed the group’s actual portfolio in two of the three years tested, and produced stronger average annual vintage MoIC across the full 2018–2020 period.
More importantly, the model appears to provide value in multiple ways. It can be used to identify higher-potential opportunities, reduce exposure to companies with weaker predicted outcomes, improve the quality of the investable universe, and inform position sizing. In this sense, the model is not a replacement for investor judgment, but an additional decision-support layer that can help make that judgment more systematic and repeatable.
Broadly speaking, angel groups may see benefit in turning their historical investment records into a repeatable source of institutional learning. Rather than relying solely on individual memory, experience, or anecdotal pattern recognition, groups can systematically test which characteristics were historically associated with stronger and weaker outcomes, incorporate those findings into future screening, and continue refining the process as new data becomes available.
Angel investing is especially vulnerable to narrative and intuition because the underlying companies are young, the data is limited, and outcomes are highly uncertain. That makes disciplined quantitative screening more important, not less. A factor model can serve as a guardrail: challenging assumptions, identifying when conventional wisdom is not supported by the data, and helping investors separate compelling stories from characteristics that have been associated with stronger outcomes.
Limitations
While the results are encouraging, several limitations should be considered when interpreting the findings.
- The model was developed and tested using data from a single angel group. Although the screening process was consistent enough to support a repeatable study design, other angel groups may collect different information, use different diligence processes, or evaluate companies at different stages. The results therefore should not be assumed to transfer directly to every angel investing environment without further testing.
- The sample sizes remain relatively small compared with those available in public markets. The model was built using just over 300 historical companies and tested on more than 350 subsequent investment opportunities. Angel investing is characterized by highly skewed return distributions, where a small number of large outcomes can have an outsized impact on portfolio performance. This makes results more sensitive to individual companies and reinforces the need for continued testing across additional vintages and larger datasets. Reported MoIC includes both realized proceeds and the recorded value of unrealized holdings as of August 2026.
- The model relies on information contained in company overview documents and the way that information was presented at the time. Some relevant characteristics may not have been captured, may have been measured imperfectly, or may have changed after the initial screening process. The model should therefore be viewed as a structured interpretation of the information available at the time, rather than a complete representation of each company.
- Allocation models may not be accurately reflecting deal size. In some instances, allocating the full amount that the factor model suggests (in the example of the Blunderbuss portfolio) may not be feasible due to logistics of deal sizing and total round size.
- This study evaluates whether quantitative information can improve decisions within an already-screened opportunity set. All investment options had survived the initial screening process of the angel group studied. The study does not test screening of the entire inbound company universe.
- This methodology is best suited to pooled fund structures, where investment selection and capital allocation can be applied consistently across the portfolio. In member-driven angel networks, the model can still provide useful guidance, but individual investors ultimately decide which opportunities to pursue and how much capital to commit, thus limiting the usefulness of a systematic investment approach.
- Finally, while the walk-forward methodology helps reduce hindsight bias and overfitting, no historical study can eliminate these risks entirely. The factor relationships identified in the training period may weaken or change as markets, technologies, founder behavior, and investment environments evolve. Continued out-of-sample testing and periodic re-evaluation of the factor set will therefore be necessary.
Taken together, these limitations suggest that the model should be viewed as a decision-support framework rather than a fully deterministic prediction system. Its value lies in improving the consistency and discipline of the investment process, while remaining subject to ongoing validation as new data becomes available.
Key Takeaways
- Quantitative screening showed meaningful predictive value. Across the tested vintages, higher factor scores were associated with stronger investment outcomes and lower write-off rates.
- The model improved portfolio selection. In 2018 and 2019, portfolios constructed from the highest-scoring companies outperformed both the angel group’s actual allocation and the median randomly generated portfolio.
- The model also showed value as a risk-management tool. All observed 2018 write-offs occurred among companies scoring below 4, while no company scoring 4 or higher was written off.
- Filtering weaker opportunities improved the overall opportunity set. In 2018, removing the lowest-scoring companies increased median simulated portfolio MoIC and materially reduced the probability of weaker portfolio outcomes.
- Factor scores can be useful for position sizing, not just selection. The Blunderbuss portfolio maintained upside exposure to every company while allocating more capital to higher-scoring opportunities and less to weaker ones, improving average annual vintage performance across the tested period.
- The signal persisted beyond the initial test year, but not perfectly. The model did not outperform the group’s actual portfolio in 2020, but factor-based portfolios continued to rank materially above random selection in all years tested.
- Quantitative models should complement, not replace, investor judgment. Angel investing remains highly dependent on qualitative diligence, but a systematic screening layer can provide a valuable counterweight to intuition, narrative, and behavioral bias.
Historical angel data may represent an underused source of institutional knowledge. By systematically testing which characteristics are associated with stronger and weaker outcomes, angel groups may be able to make their investment processes more disciplined, repeatable, and data-informed over time.
Author
Athan Gousios, Quantitative Researcher – Angel Investing and Portfolio Strategy