
Executive Summary
What actually drives member satisfaction in angel networks? This report answers that question using survey data from 101 angel investors across approximately 13 groups, analyzed through a regression-based Customer Value Equation framework.
The short answer: members stay for community first and deals second. Other things certainly matter, but not nearly as much.
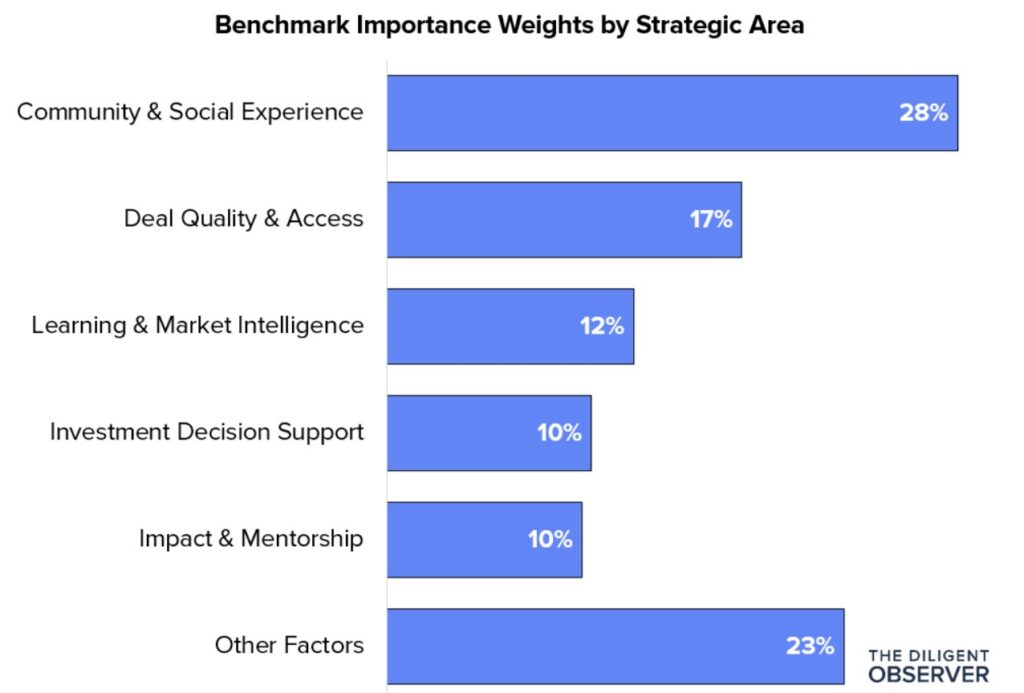
The model explains 77% of the variance in overall member satisfaction (R2 = 0.77), meaning that 23% of member satisfaction is attributable to factors not measured. All five strategic areas tested were significant predictors of member satisfaction. Community and Social Experience leads at 28% of overall satisfaction, Deal Quality and Access follows at 17%. Learning, Investment Decision Support, and Impact and Mentorship each contribute 10-12%. Overall satisfaction across the dataset is 6.1 out of 7.
What Drives Member Satisfaction
Figure 1 shows community and deal access together account for 45% of member satisfaction. The remaining named drivers split the next 27%.
If a network is deciding where to invest time and resources, the data points clearly toward initiatives that increase relationship-building and deal quality as the highest ROI options.
Figure 1: Benchmark Importance Weights by Strategic Area
Source: Diligent Observer Survey 2026
Note: Model R2 = 0.77, meaning the model explains 77% of variance in overall member satisfaction (an R² of 1.0 would mean the model predicts every respondent’s satisfaction perfectly). ‘Other Factors’ (23%) represents variance the model can’t attribute to the five measured areas.
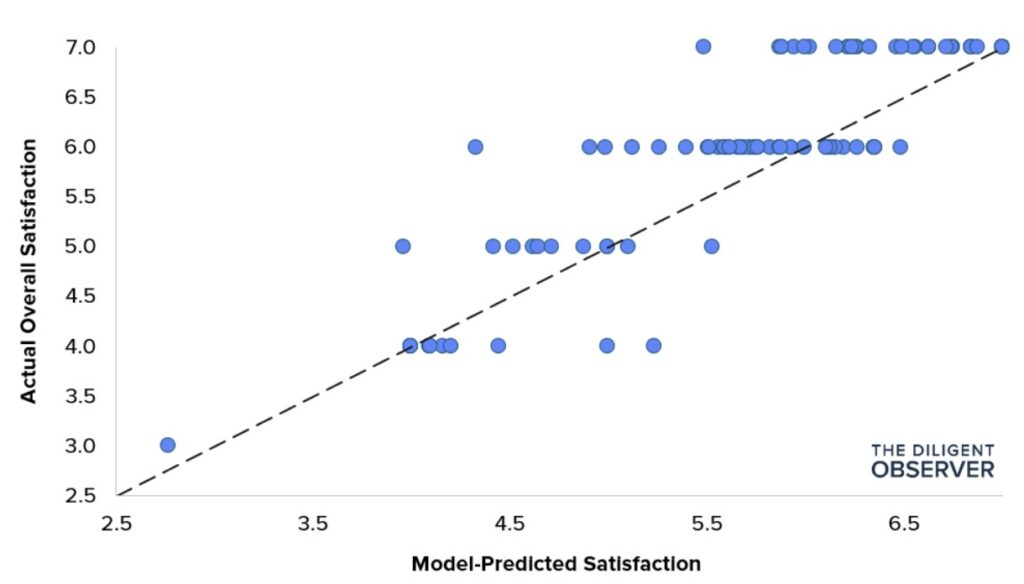
Figure 2 plots each respondent’s actual overall satisfaction against the score the regression model predicts based on their ratings in the five strategic areas. If the model captures what really drives satisfaction, the two should track closely. Most do, which is reflected in the model R² of 0.77.
On visual inspection, it seems that at the top right, a band of respondents scored 7 regardless of what the model predicted. This is likely because a respondent who feels “off the charts 8 out of 7” can only mark 7.
Figure 2: Actual vs. Predicted Member Satisfaction (n = 101)
Source: Diligent Observer Survey 2026
How Networks Are Performing
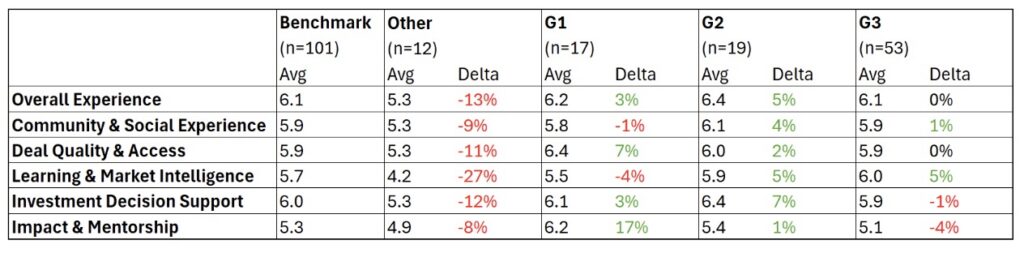
Table 3 shows how each named group (anonymized as G1-G3 for privacy) performed relative to the benchmark across overall satisfaction and the five strategic areas. For context: G1 is a university-affiliated network, G2 is an impact-focused network, and G3 is an established regional network with its own co-investment fund.
G1 and G2 both outperform the benchmark overall. G3, which contributes 53 of 101 responses and therefore shapes most of the benchmark, tracks it exactly. The named groups get there for different reasons:
- G2 (6.4/7, +5%) leads through broad-based strength rather than a single standout. It beats the benchmark in every area, led by Investment Decision Support (+7%), Learning & Market Intelligence (+5%), and Community & Social Experience (+4%). Community’s +4% matters disproportionately because it carries the heaviest importance weight (28%).
- G1 (6.2/7, +3%) posts a more uneven profile. It stands out sharply on Impact & Mentorship (+17%) and Deal Quality & Access (+7%), but trails the benchmark on Community (-1%) and Learning (-4%). Its overall lift is smaller than its standout categories suggest because Community pulls more weight than any other area. G1’s standout score on Impact & Mentorship likely reflects its university affiliation, where mentorship is often built into the network’s structure.
- G3 (6.1/7, 0%) sits squarely on the benchmark line, with its most notable deviation being Learning & Market Intelligence at +5%.
Table 1: Average Performance by Network
Source: Diligent Observer Survey 2026
The fourth segment, “Other” (n=12), underperforms on every dimension, worst on Learning & Market Intelligence (-27%) and Investment Decision Support (-12%). These respondents came through open newsletter solicitation rather than a structured benchmarking effort, so the sample may skew toward less-satisfied members.
Two other observations from the group view. First, Impact & Mentorship varies more across the named groups than any other dimension, spanning from -4% in G3 to +17% in G1. Second, small samples for G1 (n=17) and G2 (n=19) mean their deltas are best read as directional signals.
Key Takeaways
- Community is at the center of it all. At 28% of overall satisfaction, it outweighs every other driver.
- Deal quality is the second most important lever. At 17% importance weight, this is not an assumed baseline; it actively differentiates the member experience.
- Learning and Market Intelligence is a meaningful but mid-tier driver. It contributes 12% to overall satisfaction, placing it in the middle of the importance ranking.
- Investment Decision Support is performing well, but with limited impact. Highest score (6.0/7), but fourth in importance.
- Impact and Mentorship scores lowest (5.3/7) and carries the lowest importance weight (10%), but varies widely across groups (-4% to +17%) and may suffer from inconsistent category interpretation.
My Reflections
I enjoyed this exercise and learned a lot about how members think about the value of their angel network memberships.
I am not surprised to see community and deal quality at the top – these match the pattern I have observed across networks over the years. What did surprise me is how far community stands ahead of deal quality.
I was also surprised by how differently G1 and G2 outperformed the benchmark. G2 gets there with broad strength across every area. G1 gets there through sharp peaks on specific areas paired with material gaps on others. This suggests there may not be a single formula for a high-performing network.
A few important caveats on this dataset:
- One large group contributed 53 of 101 responses, which means the benchmark is more heavily influenced by that group’s experience than I would like. The directional findings hold, but I would trust these weights more with a broader, more evenly distributed sample.
- A related limitation: three groups contributed named samples representing roughly 88% of responses, and all three are professionally managed organizations. The remaining responses came from a dozen individuals spread across a variety of other groups. As the dataset grows, examining variation across group types, from professionally managed networks to more informal member-led clubs, will be a useful next layer of analysis.
- The category definitions also need work. I have gotten feedback that some areas – Impact and Mentorship in particular – are not well defined enough for respondents to rate consistently. That is something I plan to address the next time we run this analysis.
- This analysis will improve meaningfully as more groups participate. If your network is interested in a benchmark comparison, reach out and I will be happy to work with you.
Methodology
Survey respondents rated satisfaction with five strategic areas and their overall experience on a 7-point scale. Multiple regression quantified the unique contribution of each area to overall satisfaction. Importance weights are derived by dividing each significant coefficient by the sum of all significant coefficients, then scaled by R2 to reflect share of total explained satisfaction.
Sample: 101 responses from approximately 13 angel groups. Three groups contributed named samples; the remainder came through an open network survey solicitation through The Diligent Observer newsletter.
Significance threshold: p < 0.05. All five areas cleared this threshold in the benchmark model. Any area failing to reach this threshold would receive a 0% importance weight and be interpreted as a baseline expectation rather than a satisfaction driver.
Regression detail: Multiple OLS, five predictors, n = 101. Adjusted R2 = 0.763. Standard error = 0.486. F-statistic significant at p < 0.001.
Framework: Adapted from the Customer Value Equation, Collaborative for Customer-Based Execution and Strategy (CUBES), Texas A&M University.