Trends in Funding Rates – What’s Hot and What’s Not – Part 2
This is the sequel to last month’s Data Insight looking at trends in funding rates. Last month we covered:
- Funding Stage
- Development Stage
- Customer Focus
- Accelerator/Incubator
- Pre-Money Valuation
- Commitments
- Lead Investor
- Prior Funding
- Registered/Incorporated
- Under-Represented Founders
This month we will cover:
- Country
- Region within the USA
- State/Province
- Industry
- Hardware/Software
- Technology
- Exit Strategy
As with Part 1, we will be using data from Dealum, the leading deal flow and collaboration platform for angel groups. The first US angel group started using Dealum in 2021, followed by more groups in 2022, so they have three years of data about the US fundraising market covering over 12,000 applications for funding; this is probably the most extensive source of information on funding rates available.
Let’s start with the funding rate by Country. Over the past three years, the funding rate has consistently been higher for Canada than for the United States, and the Rest of the World has been even lower. Combining the three years, Canada has seen a 11.3% funding rate compared to 6.0% for the USA and 1.9% for the Rest of the World. However, 91% of the companies applying are in the USA, compared to 4% in Canada and 6% for the Rest of the World:
Funding Rate by Country
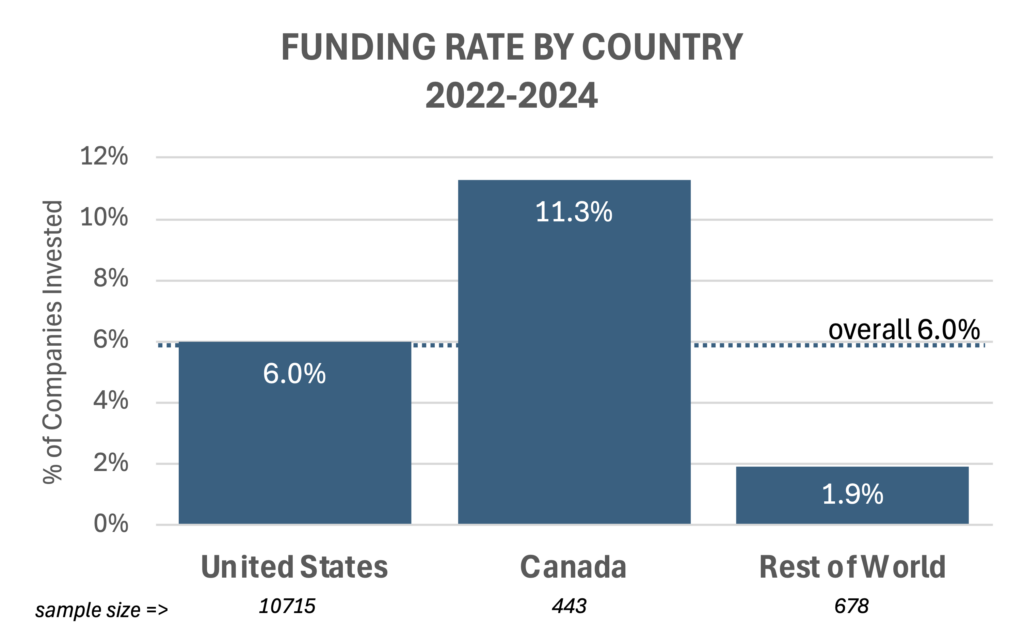
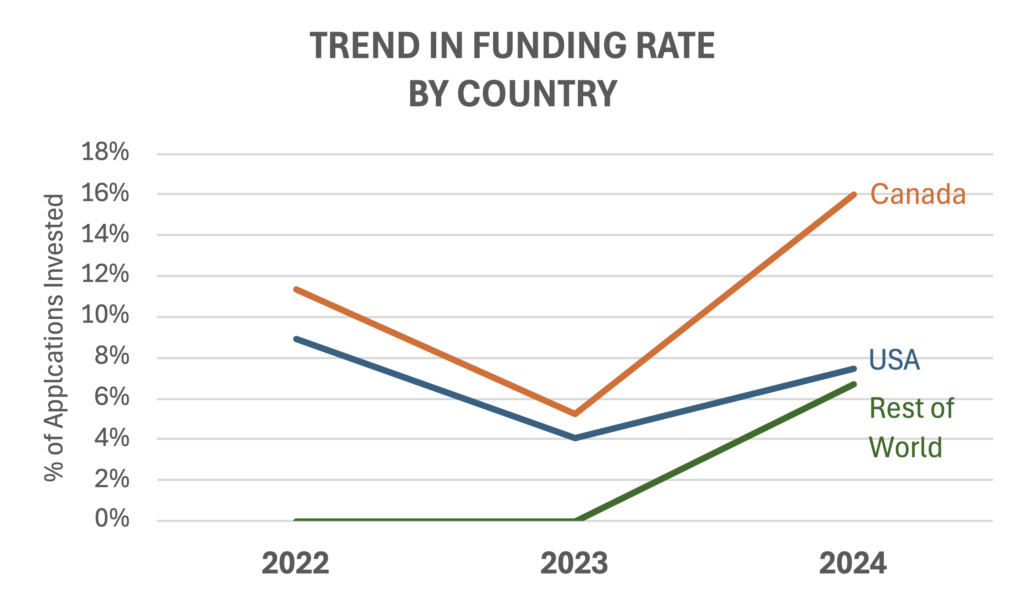
Source: Dealum
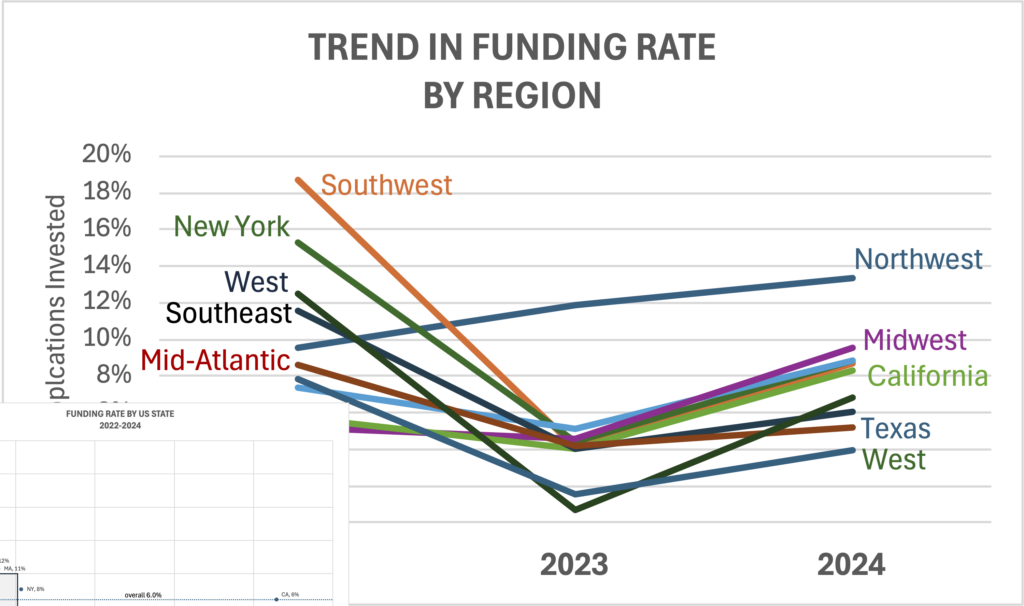
Within the USA, the funding rate was highest in the Northwest, where 12.4% of companies were funded over the past three years. Next highest was the Southwest where 8.4% were funded, followed by New York at 7.7% and New England at 7.0%. California had the most companies and were funded 6.1% of the time — which is the same percentage as the average for all of the USA. In the most recent two years, Northwest and Midwest have had the highest funding rates:
Funding Rate by Region
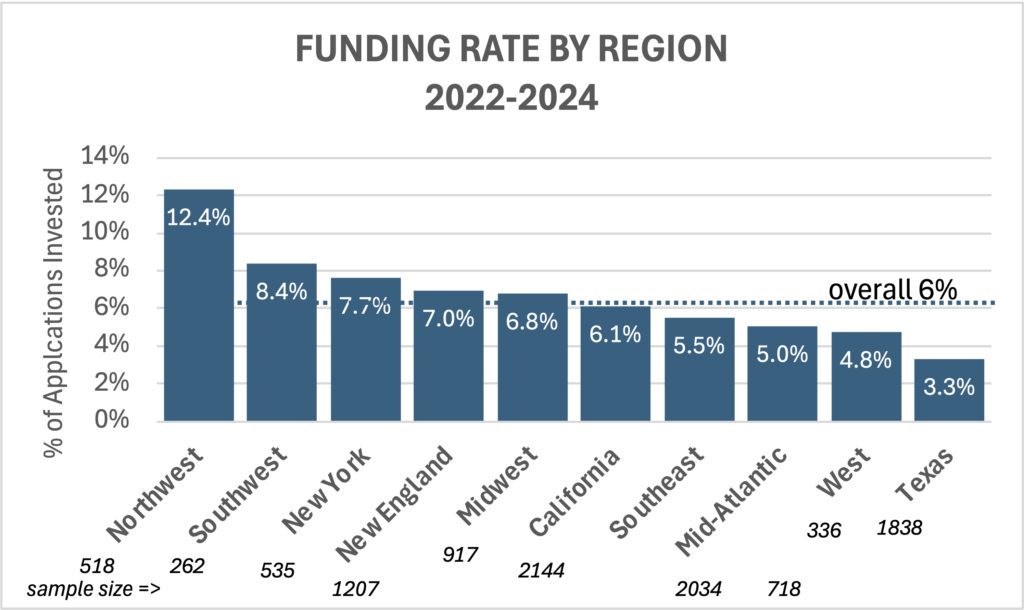
Source: Dealum
Turning next to individual states, California and Texas had by far the most companies applying, but while the California funding rate was consistent with the national average of 6%, the funding rate in Texas was half that at 3% of applications. The next two largest states were Florida and Delaware, and both were also at only 3%. New York was the fifth largest state, and was unique among the large states in that the funding rate of 8% exceeded the national average. The fact that three of the four largest states funded at half the national rate suggests that the robustness of the local ecosystem of early stage companies does not directly translate into higher odds of funding – perhaps exploding the myth that companies are better off locating in those larger states because of readier access to funding.
Funding Rate by US State
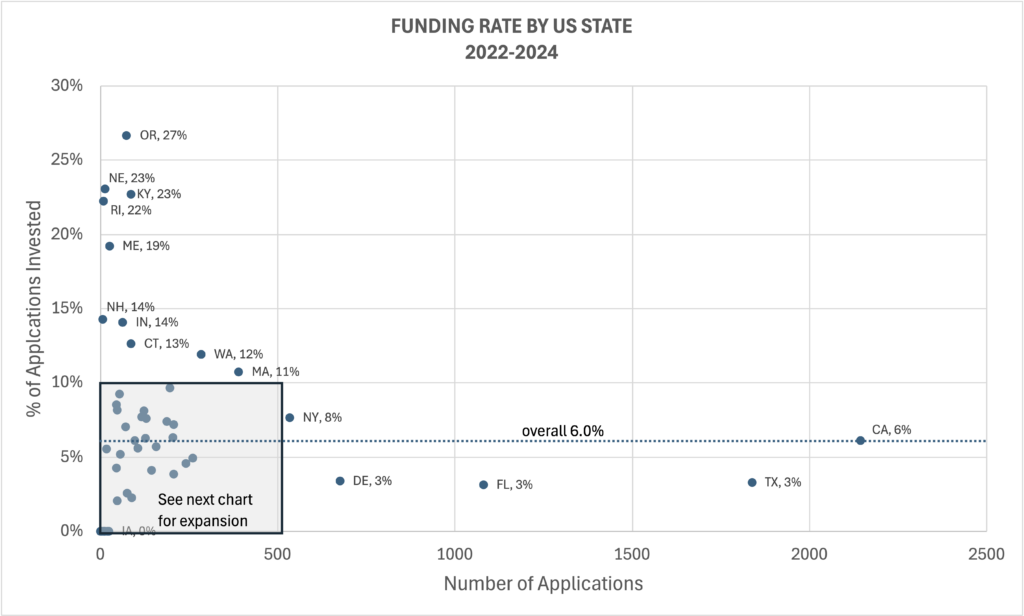
Source: Dealum
Looking at the smaller states with less than 300 companies, the states that were funding companies above the national average were North Carolina (9.6%), Alabama (9.3%), Idaho (8.5%), New Mexico (8.2%), Ohio (8.1%). Minnesota (7.7%), South Carolina (7.6%), Virginia (7.4%), Arizona (7.2%), Nevada (6.3%) Illinois (6.3%) and Utah (6.1%).
Funding Rate by US State – Small
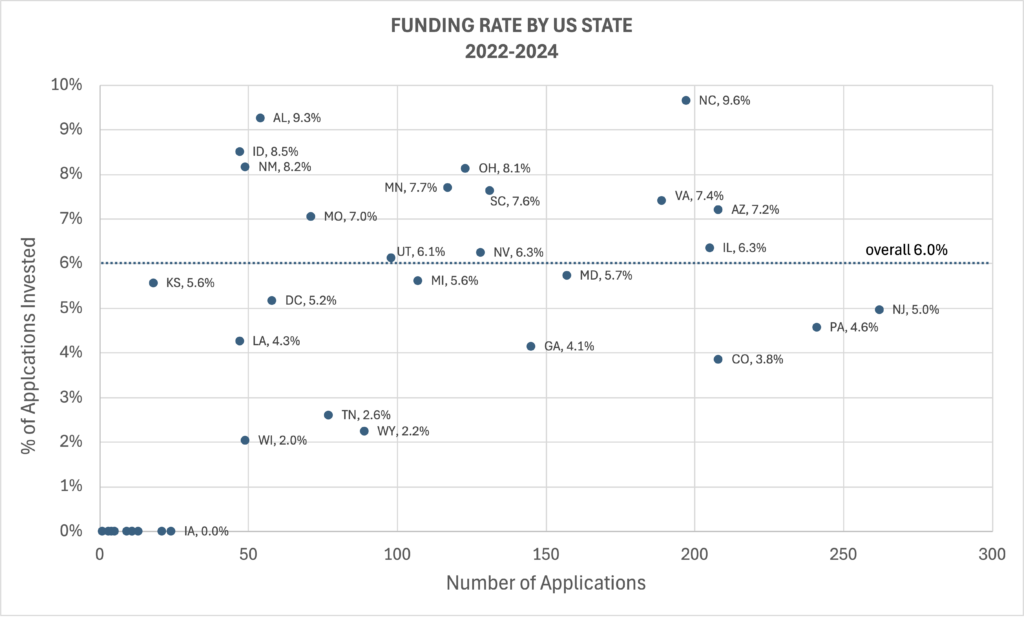
Source: Dealum
Turning to the provinces of Canada, the odds of funding were highest in some of the provinces with relatively few companies applying – such as Alberta (26% funded) and British Columbia (14% funded). The province with the most companies applying for funding was Ontario where the funding rate was 8% — below the Canadian average of 11.5%. So this is a similar pattern as the USA where it may not be true that moving a company’s location to the geographies with the most companies and most highly developed startup ecosystems means a company increases its odds for funding:
Funding Rate by Canadian Provence
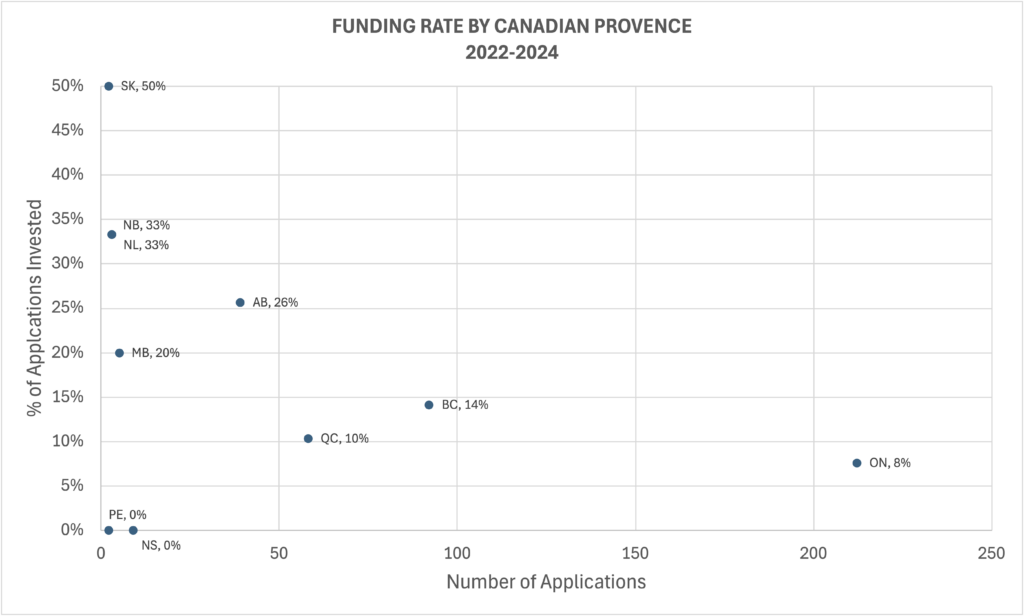
Source: Dealum
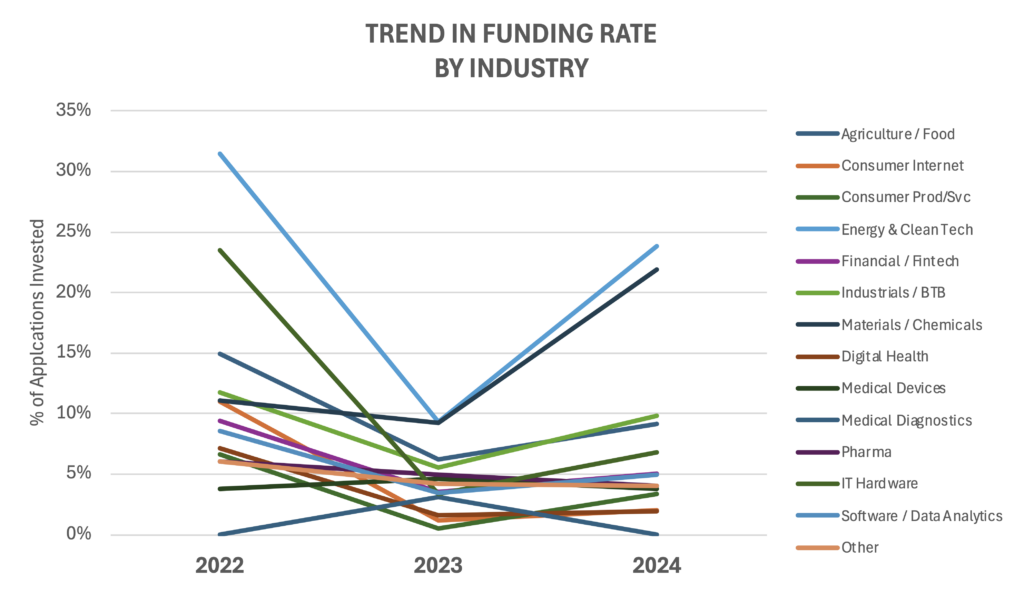
Turning next to industry verticals, the funding rate was highest in Energy & CleanTech (18.0%), Materials/Chemicals (14.4%), Agriculture/Food (8.3%) and Industrials/BTB (8.0%). The funding rate was lowest in Medical Diagnostics (1.5%), Consumer Products and Services (2.4%), Consumer Internet (2.5%), and Digital Health (2.5%).
Funding Rate by Industry
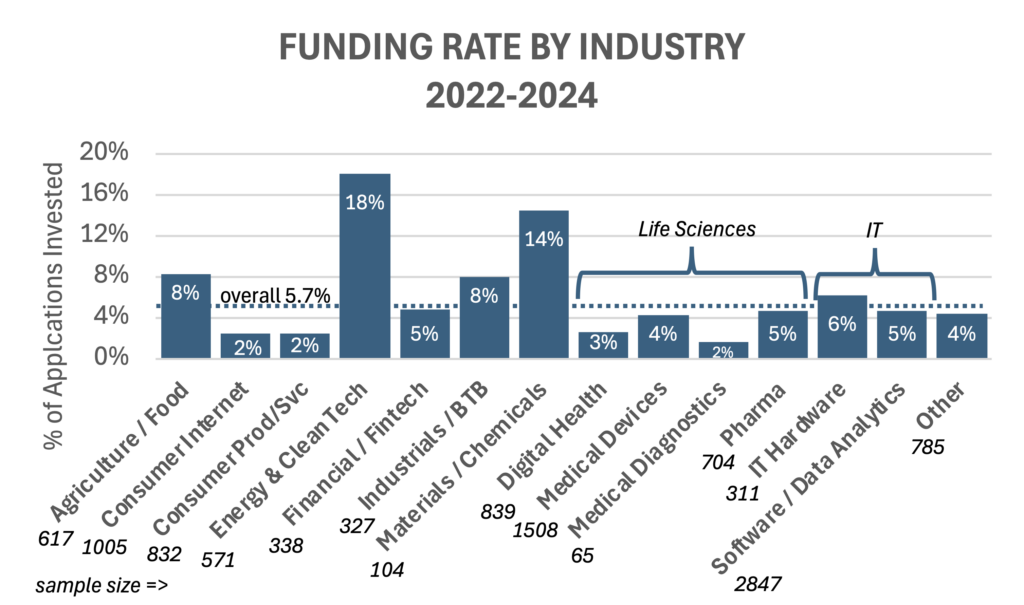
Source: Dealum
It is not a coincidence that consumer businesses, medical diagnostics and digital health had lower funding rates because these verticals also have a weaker track record in terms of investment returns compared to other industries based on analysis of returns by vertical among TCA Venture Group’s first 281 outcomes:
Outcomes by Industry
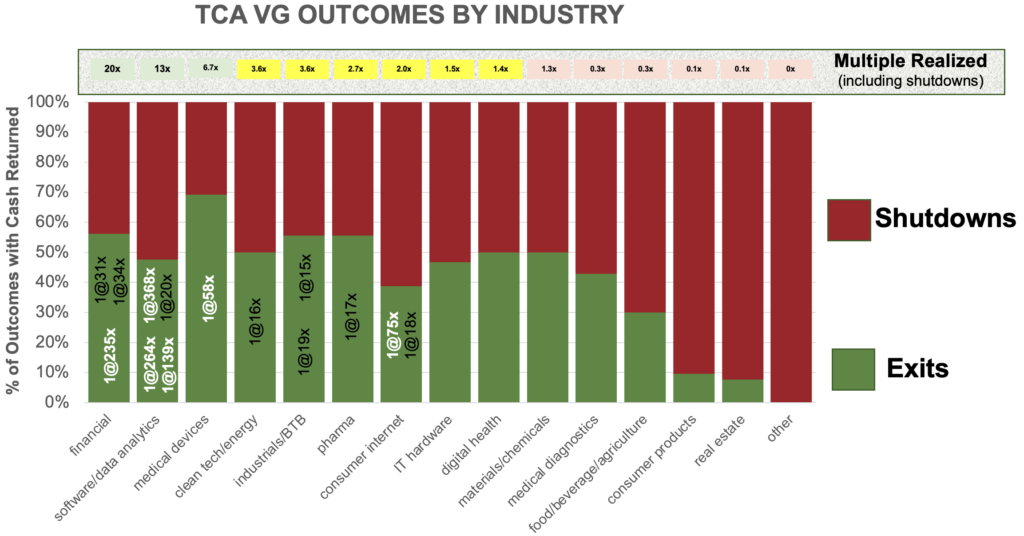
Source: Analysis of all 281 TCA Venture Group portfolio companies with Outcomes (Exits or Shutdowns) 1997-2023
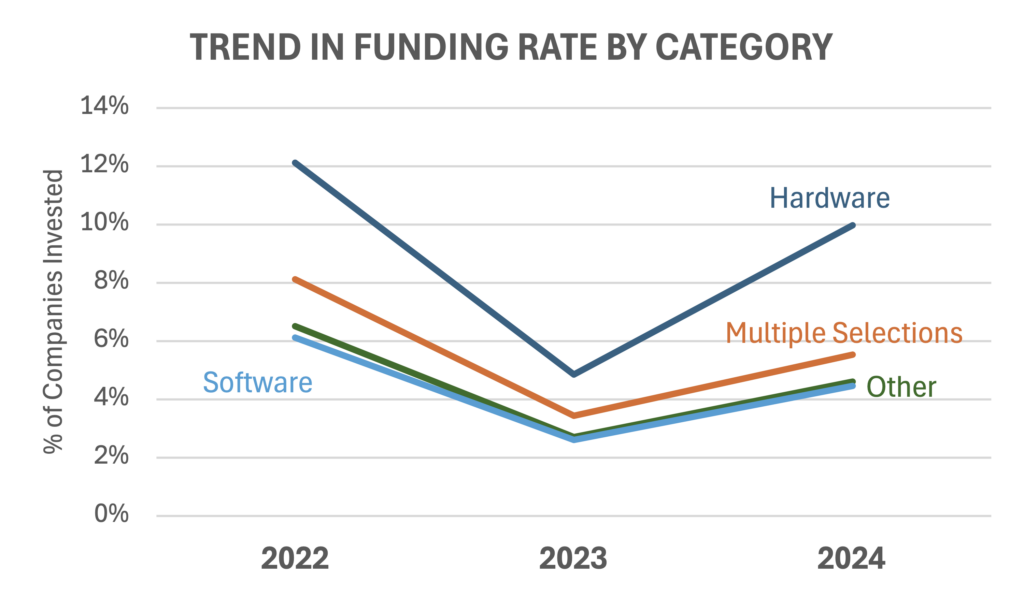
Turning to the types of business, those that are characterized as purely hardware business had a higher funding rate (7.8%) compared to pure software businesses (3.7%), which is surprising since as the above chart shows TCA VG’s returns have been the second highest in Software/Data Analytics (average 13.8x multiple on combined exits and shutdowns):
Funding Rate by Category
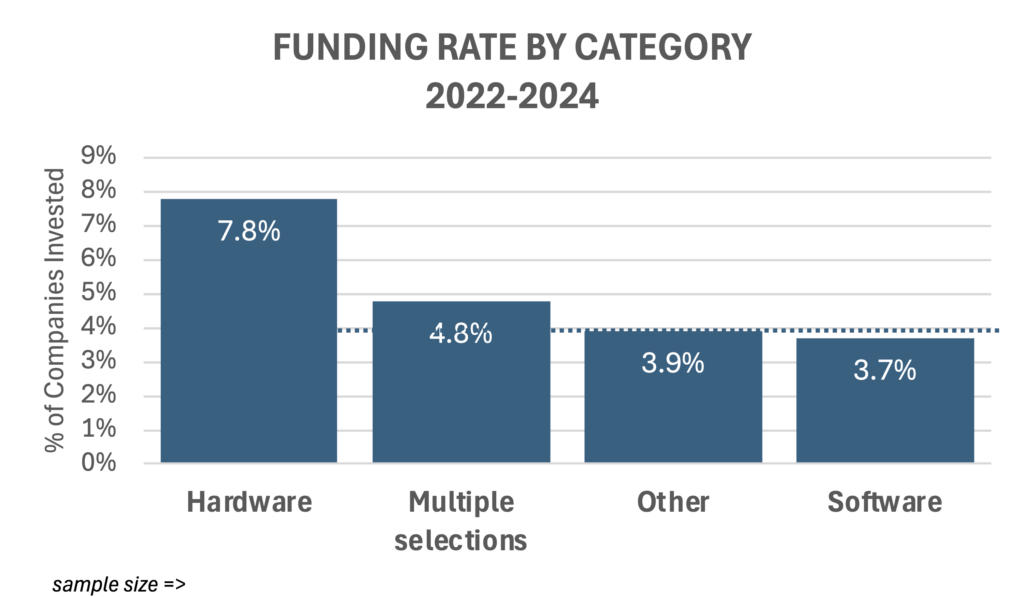
Source: Dealum
There is a wide variation in funding rates for different technologies:
Funding Rate by Technology
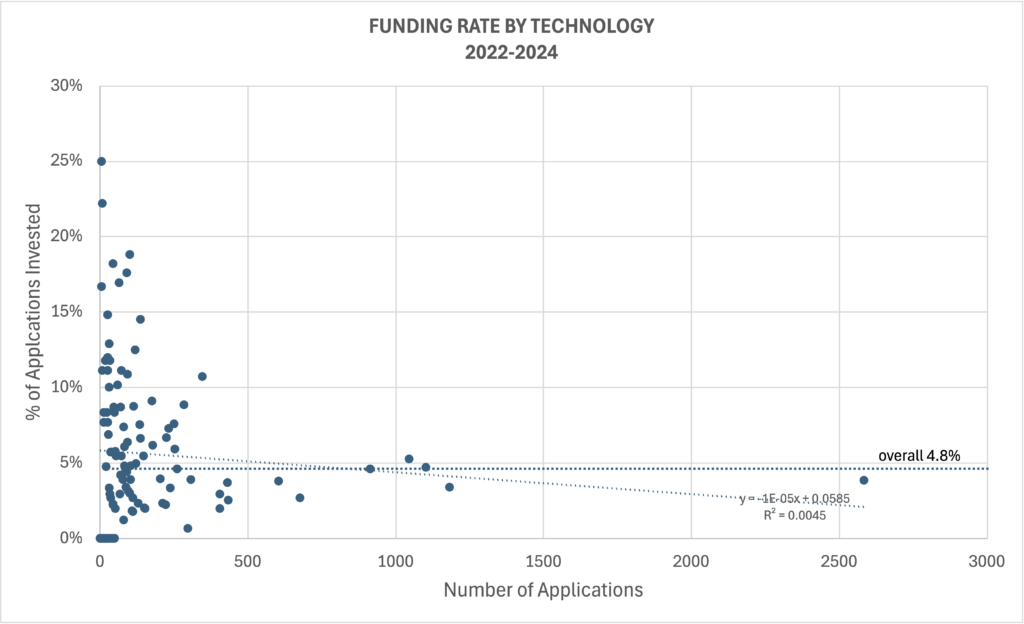
Source: Dealum
For the most prevalent technologies (those cited in more than 300 applications), the above average funding rates were in Advanced Materials (10.7%) and Data Analytics (5.3%). AI was cited most frequently (about 20% of the applications) but interestingly did not result in a higher funding rate (only 3.8% of those AI companies were funded):
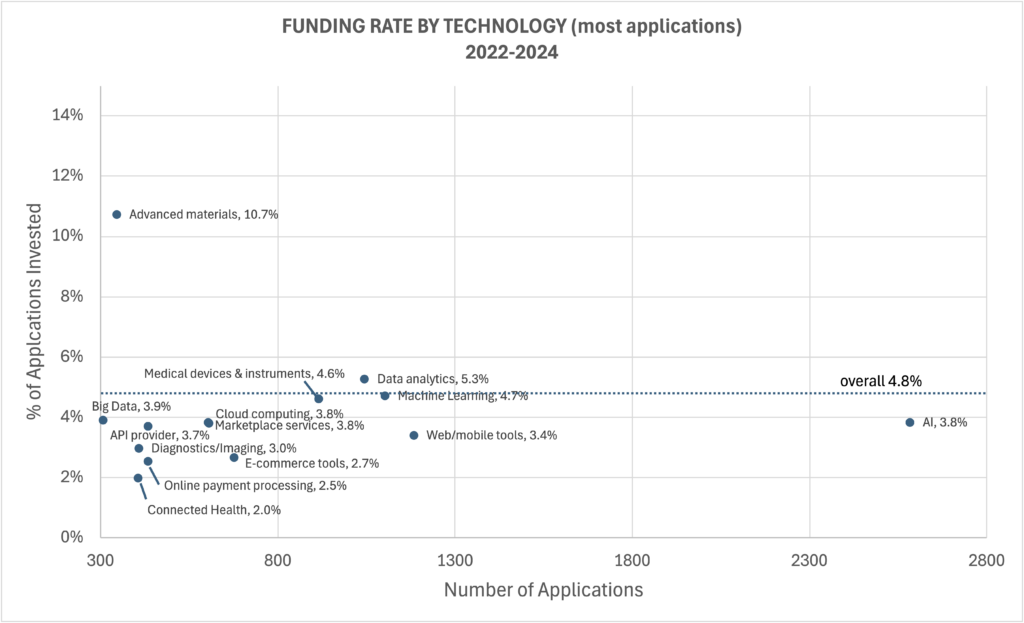
Source: Dealum
Among companies with technologies identified between 100 and 300 times, the highest funding rates were in Solar energy (14.5%), Battery storage (12.5%), Computer Vision (9.1%), CAD/CAM software (8.8%), Production machines (8.8%), 3D printing (7.6%), Synthetic Biology (7.5%), Biomaterials (7.3%), Natural Language processing (6.7%), Special purpose algorithms (6.6%), Polymer (6.2%), IoT (5.9%), and Nanotechnology (5.5%). Among technologies resulting in the lowest funding rates were Blockchain (0.7%), Biometrics (1.8%) and Cybersecurity (1.9%); this author was not surprised at low funding for Blockchain (due to the poor value proposition), but surprised that cybersecurity was so low.
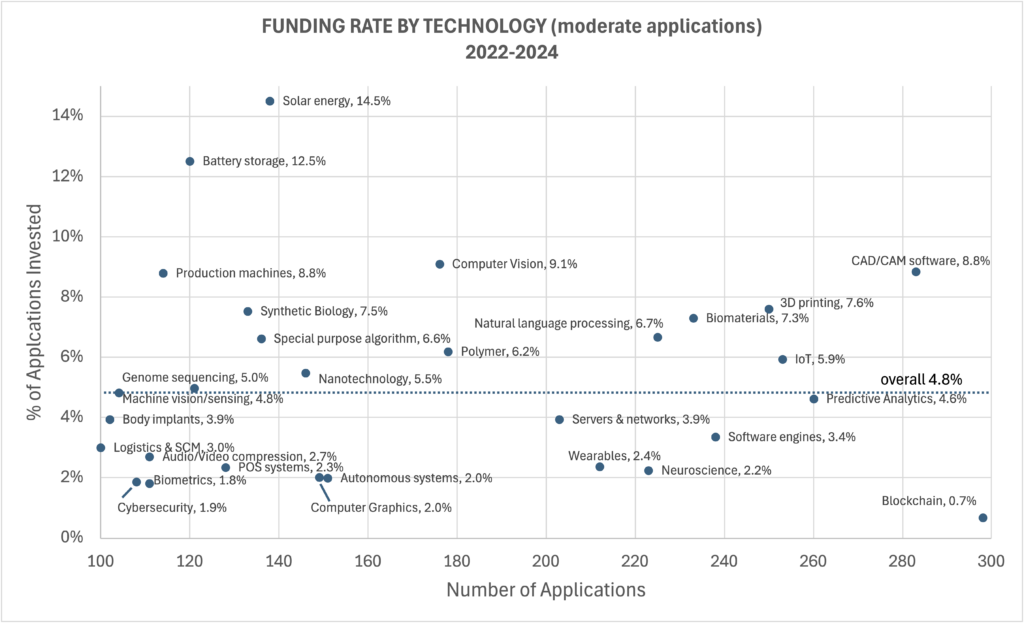
Source: Dealum
Finally, looking at the technologies least prevalent, several of the ones with the highest funding rates were in the Energy & CleanTech vertical, and include Smart grid (18.2%), Waste separation/recycling (17.6%), Purification technology (16.9%), Wind turbines & blades (11.8%) and Fuel cells (11.1%). Looking ahead, the funding rate for these clean initiatives may decline under the new U.S. administration due to its strong aversion to acknowledging climate change and providing financial support to CleanTech. Other technology standouts among these more esoteric technologies included Metal Processing (14.8%), Advanced Driver Assistance Systems (12.9%), Precision Agriculture (11.1%), and Embedded systems (10.9%). Among the lowest funding rates was Cryptocurrency with only 1.2% funding – suggesting early-stage investors see the weak value proposition for cryptocurrency businesses.
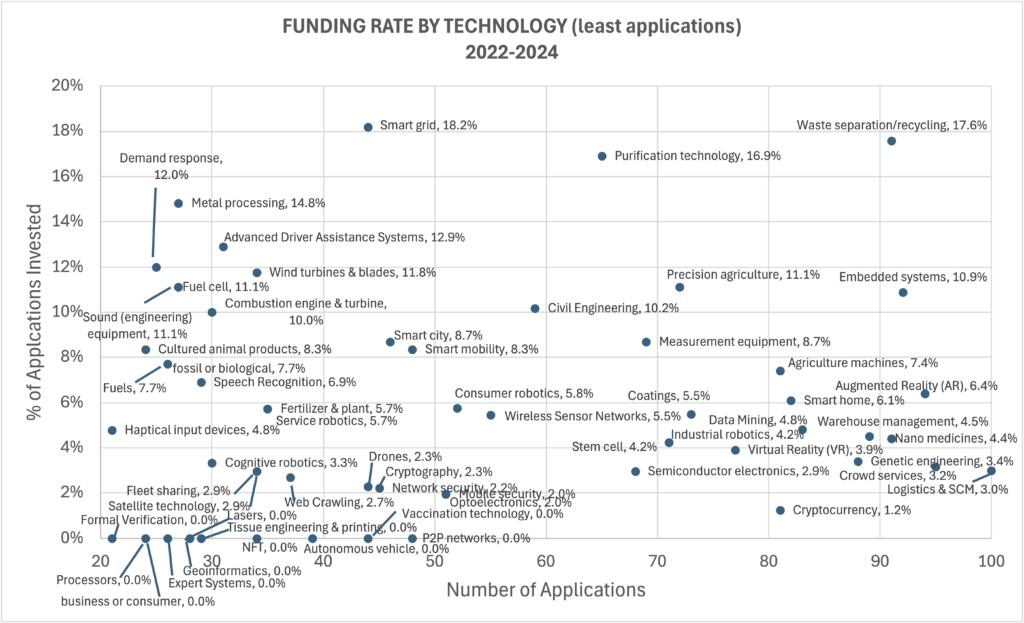
Source: Dealum
Wrapping up this analysis, let’s turn to which exit strategies are more likely to get funded. Company buyouts seem to fare best with 7.0% funding, while identifying IPOs as the exit path result in lower funding rate of only 3.4%.
Funding Rate by Exit Strategy
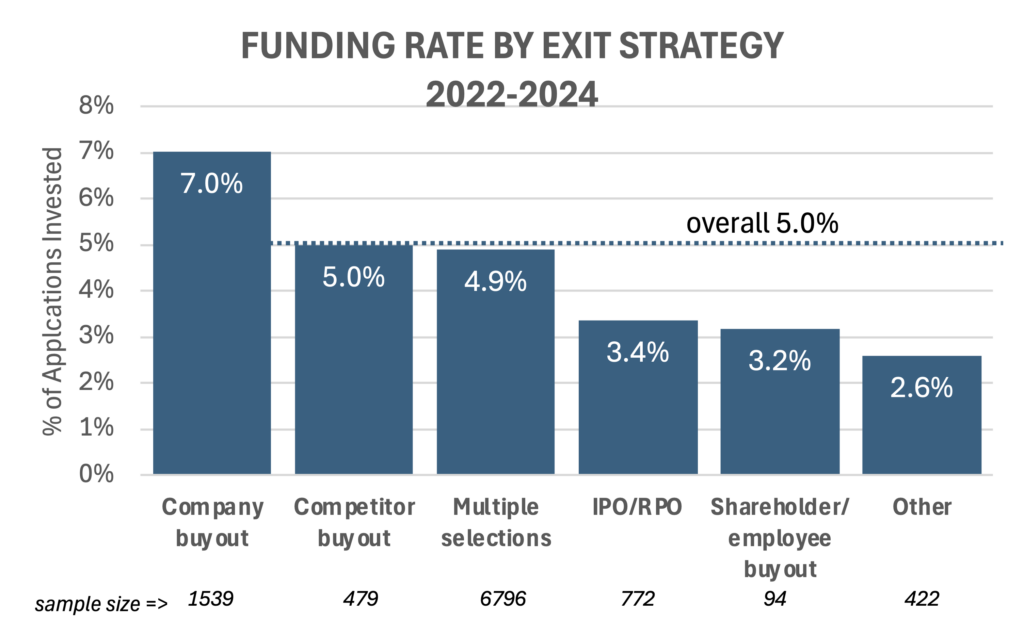
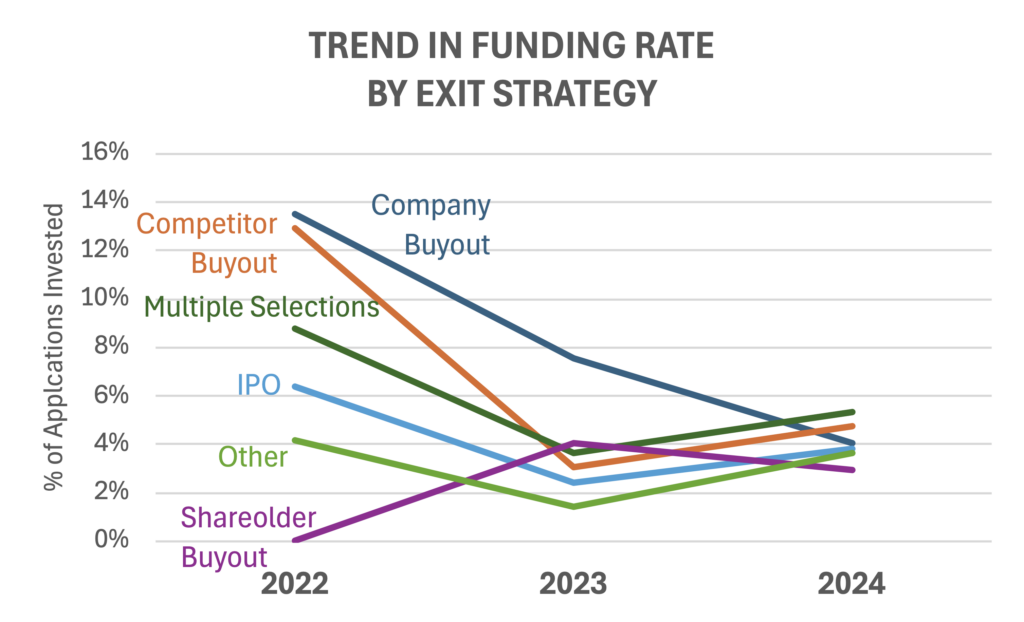
Source: Dealum
KEY TAKEAWAYS
- For investors, paying attention to “what’s hot and what’s not” may improve the odds of securing follow-on funding in later rounds and potentially better exit odds, although if the hotness is a fad that may likely fade by the time the company is ready for an exit
- For entrepreneurs, understanding “what’s hot and what’s not” may help them in what they emphasize in their presentations to investors – seeking to promote resonance with what is most interesting to investors.
- As ACA begins to analyze the data on 2024 investments (as well as exits and shutdowns), we will be exploring how these funding rate patterns from the Dealum data set relate to the 60+ Angel Groups that have provided data for the ACA Angel Funders Report — which ACA expects to release in June 2025 (but provide a sneak peak at the ACA Summit in Denver on April 15).
AUTHOR: John Harbison, Chairman Emeritus of TCA Venture Group and ACA Board Member
…with help from the team at Dealum
Dealum is the leading deal flow and collaboration platform for angel groups, built with angel network managers in mind. The platform makes deal sharing and syndication, pipeline and funnel management, and investor communication more efficient while creating a collaborative and thriving early-stage investor ecosystem.