We have all heard the importance of having one or more of our angel investments noted as a “home run” In terms of a return exit. What is a “home run”? Generally speaking we can define a home run for an angel investor as a company having a very successful return multiple at the time of their exit, generally with a return multiple of 10.0x or more. Why is this important? In round numbers approximately 50% of angel investments go out of business or shutdown, another 25% to 30% will return less than 1x to 4x and finally approximately 20% to 25% of angel investments will be greater than 4x. The “home runs” I believe, fall into the 10x or greater return multiple.
Based on this knowledge it is very important for angel investors to build a portfolio of angel investments to potentially increase the likelihood of having a “home run” in the portfolio. How many investments are required to build a potentially successful angel investing portfolio? Irvine Ebert of Purple Angels in Ottawa performed a Monte Carlo simulation of the 2007 Rob Wiltbank study of angel investing and noted that 22-24 investments were necessary to have a 90% probability of a 2.6x return. That internal rate of return is approximately 27%. Monte Carlo studies of the Tech Coast Angels portfolio done by John Harbison have also confirmed this figure of 22 to 24 investments in a portfolio necessary to achieve a 2.5x to 2.6x return multiple or an internal rate of return 22% to 26%.
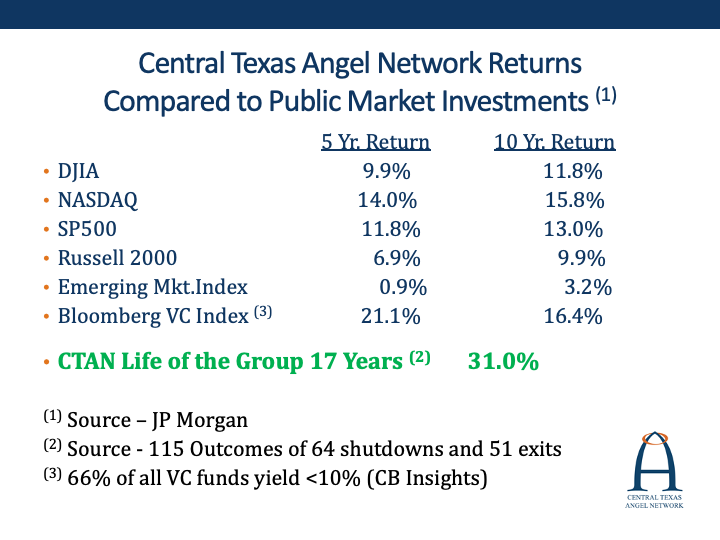
Now let’s look at the Central Texas Angel Network (CTAN) portfolio. CTAN is a very active angel group formed in 2006 and operating through 2022 in Austin and has invested in a total of 208 companies and a total of $125.2M. In 17 years of investing by CTAN members, the total portfolio has had 64 company shutdowns/companies out of business, 51 companies with an exit and 93 companies still active. The 115 companies with outcomes (64 shutdowns and 51 exits) have an overall internal rate of return of 31%. As shown on the chart below that 31% IRR compares very favorably to the 5 year and 10 year returns of several public market indices also noted on this same chart.
FIGURE 1: CTAN Returns vs. Public Market Returns
Source: Bloomberg and JP Morgan
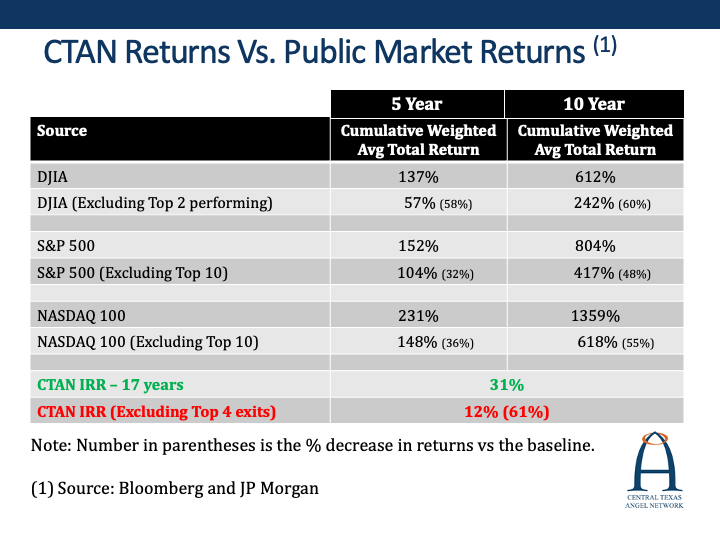
In order to better understand the potential impact of “home runs” in public markets, I focused on the public market indices which are the Dow Jones Industrial Average (DJIA), the S&P 500 and the NASDAQ 100. These three indices are snapshots of the equities markets that can provide investors with an idea as to how the overall stock market is performing. The chart below shows us the cumulative weighted average total returns over a 5 Year and 10 Year period. I have been provided this data by JP Morgan associates using the Bloomberg data base. On the chart below the weighted average total return is a calculation of the return of these respective portfolios according to the market capital weights of each stock in their corresponding index. These index weightings are pulled using the Bloomberg index member weightings. The weighted average total return is the cumulative return on the various indexes, in this case five and ten year cumulative returns.
FIGURE 2: Central Texas Angel Network Returns vs. Public Market Returns
Source: Bloomberg and JP Morgan
With this background in mind we can now look at the three public market indices noted above. To gauge the importance of “home runs” in public markets, I have excluded the top two performing stocks in the DJIA. In the S&P 500 I have excluded the top 10 performing stocks, and finally in the NASDAQ 100 I also excluded the top 10 performing stocks. The difference in returns over the five year and ten year periods are dramatic as seen on the chart.
In reviewing the DJIA figures, the impact of excluding the top two performing stocks is very dramatic in terms of overall returns. The DJIA cumulative return over five years is 137%, however that return drops to 57% when excluding the top two performing companies. This is a 58% drop in returns, which is very compelling in terms of overall returns. Jumping to the ten year return it shows an overall cumulative return of 612% compared with all stocks in the index, compared to 242% when excluding the top two performing stocks for 60% reduction in returns. For reference the top two performing stocks in this index being excluded are Apple and Microsoft.
In looking at the performance of the S&P 500, the weighted average total return is 152% compared to 104% when excluding the top 10 performing stocks for a 32% decline. It is a much larger drop at the ten year mark, going from 804% total cumulative return to 417% total cumulative return excluding the top 10 performing stocks or a 48% decline. The NASDAQ 100 return also has a big impact when excluding the “home run” companies. The five year weighted average cumulative total return is 231% for all companies, compared to 148% when excluding the top 10 performing stocks or a 36% lowering of returns. The ten year return for the NASDAQ 100 shows a weighted average cumulative total return of 1359%, yet when excluding the top 10 performing stocks this index falls to 618% or a significant 55% decline.
When we shift to the CTAN portfolio of returns as noted on the previous chart, the internal rate of return is a very good 31%. However as noted at the bottom of the same chart with public market returns, when we exclude the four highest IRR performing exits, the CTAN IRR falls to 12%. This is still a respectable return but down 61% when compared to the return with all exits. Clearly having “home runs” in this angel portfolio dramatically increases the IRR. Another point of reference with respect to “home runs” impacting angel group returns and the need to build an angel portfolio is Tech Coast Angels. Their overall return on 247 outcomes is 6.4x with an Internal Rate of Return of 25%. If you back out their six “home runs” the return multiple falls to 1.8x and the IRR drops to 9%.
Key Takeaway:
After reviewing this data one can conclude that “home runs” are important to achieve excellent returns in angel investing AND also in public marketing investing. Building a portfolio in angel investing AND public market investing is an important consideration when endeavoring to invest in these areas. Again, as noted on the first chart, successful angel investing can outperform public markets noting the total Central Texas Angel Network IRR of 31% versus several public market returns also provided on the first chart. There are many variables in building a successful angel investing portfolio including investing in the appropriate number of companies, investing in initial rounds versus follow-on rounds, investing in different verticals, consideration for first-time and experienced CEO’s/founders, and other important factors.
Rick Timmins , Central Texas Angel Network and ACA Board Member.


