As a preview of the 2025 Angel Funders Report (to be published in early August), big picture takeaway is that 2024 continued to be a challenging year for early-stage funding, with investments by ACA member groups declining 6% after a 33% drop in the previous year.
FIGURE 1. ACA ANGEL INVESTMENTS DECLINED 6% YOY
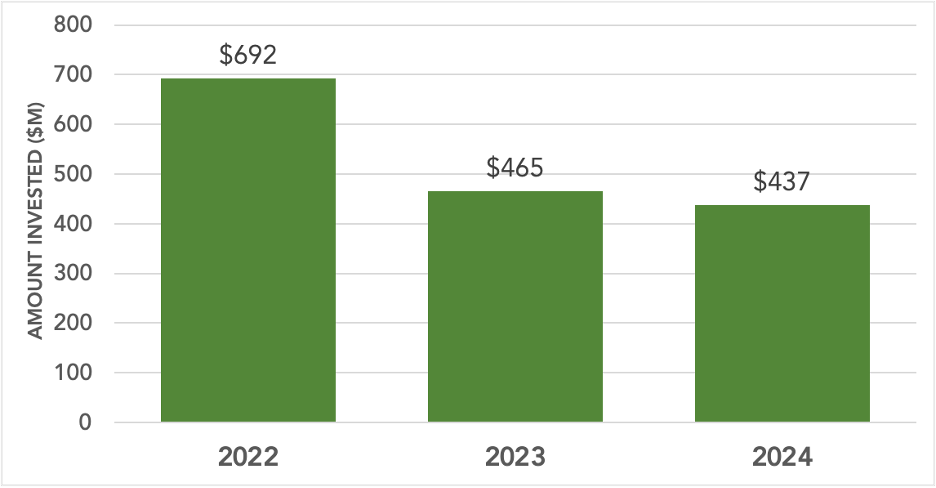
Source: 2025 ACA Angel Funders Report
But this summary picture masks a wide variation in trends across Angel Groups. Some grew their investment dramatically, while others pulled back dramatically. This Data Insight will explore these divergences and hopefully shed some light on what distinguishes the groups growing the most.
First, we should note that hybrid groups (those that have both direct member investment and investment through funds) have the greatest concentration of large groups (in terms of investment levels). 38% of the hybrid groups are over $5M in investment compared to 8% of the network groups and none of the fund only groups.
FIGURE 2. GROUP INVESTMENT BY GROUP STRUCTURE
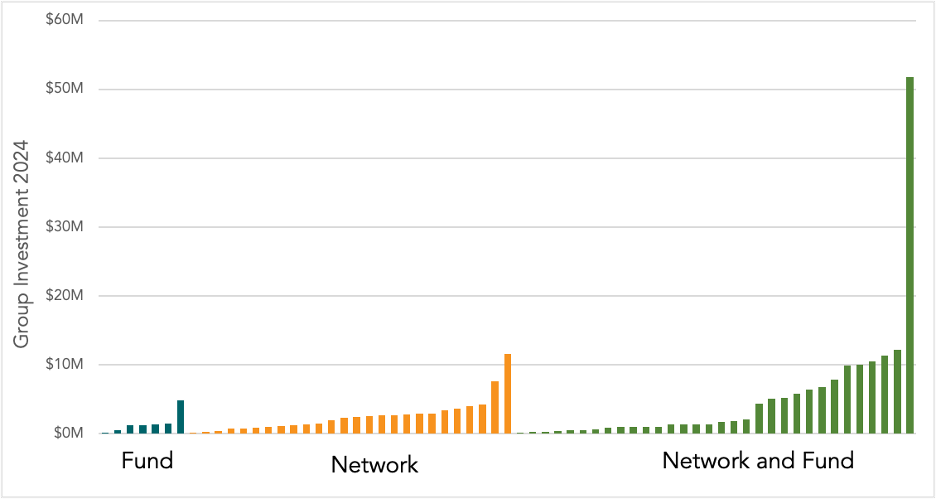
Note: Each column represents an angel group
Source: 2025 ACA Angel Funders Report
Among the three types of group investment structures, some of the Network and Fund groups are growing the fastest, although all three types have a spectrum of gainers and decliners.
FIGURE 3: INVESTMENT GROWTH BY GROUP STRUCTURE
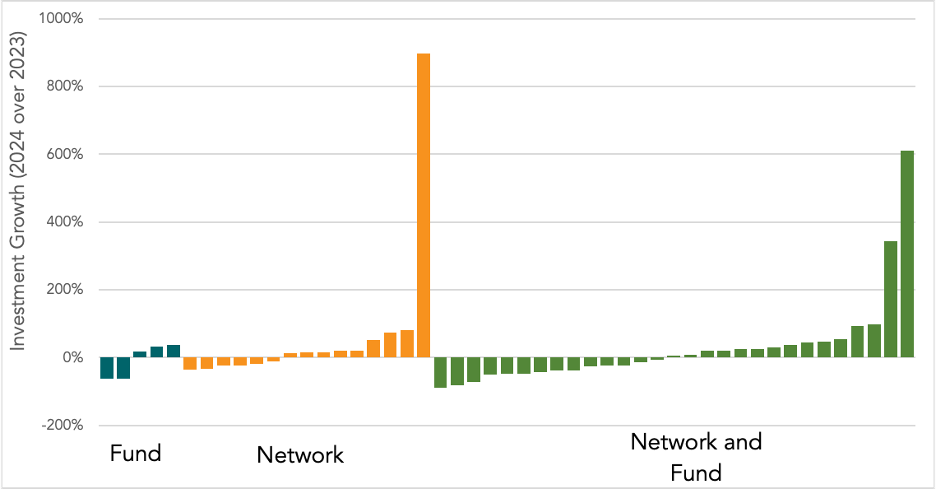
Note: Each column represents an angel group
Source: 2025 ACA Angel Funders Report
While growth rate is higher for larger groups, there is a lot of variation amongst both smaller and larger groups – although the variation is more dramatic for the smaller groups.
FIGURE 4. GROWTH BY MEMBER SIZE
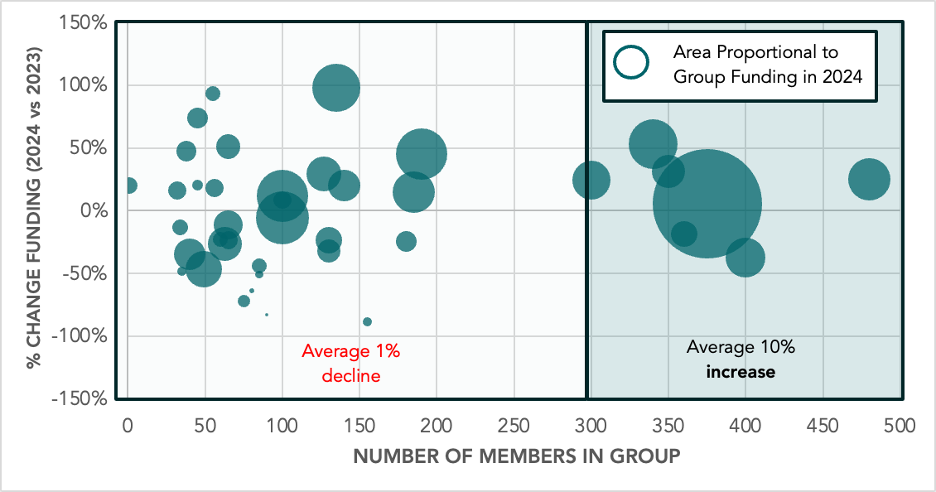
Source: 2025 ACA Angel Funders Report
Looking at the maturity of the groups, the more mature groups had a tighter band of growth outcomes, and higher average growth. But again, the dispersion in each group is dramatic.
FIGURE 5. GROWTH BY MATURITY
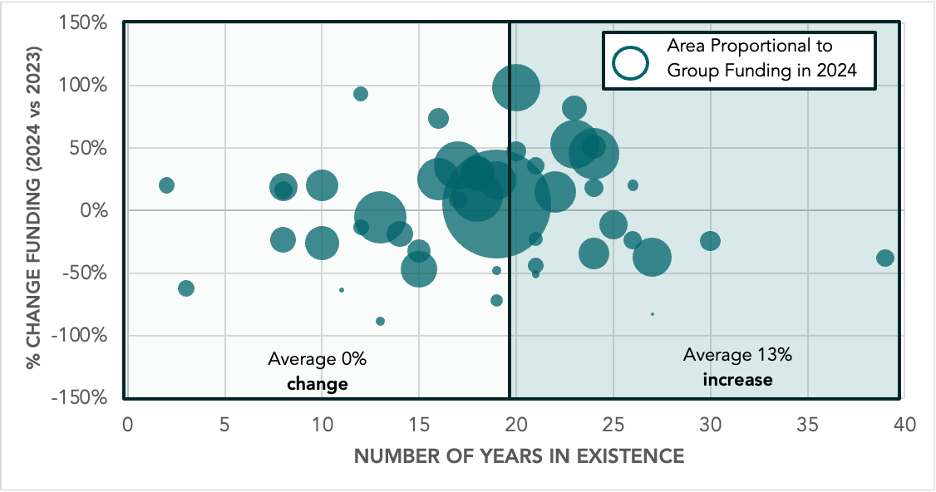
Source: 2025 ACA Angel Funders Report
Growth by region shows there were gainers and losers in angel groups located in most regions, with no particular pattern of some regions doing more investment growth than groups located in other regions. The Southwest grew the most, but there were only two groups reporting in that region; Mid-Atlantic contracted the most, but again there were only 4 groups reporting.
FIGURE 6: INVESTMENT GROWTH BY ANGEL REGION
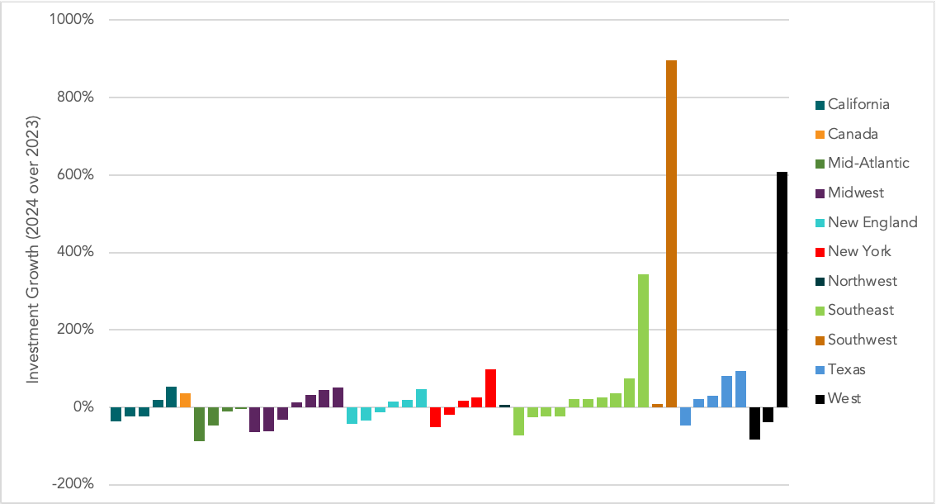
Source: 2025 ACA Angel Funders Report
KEY TAKEAWAYS
- Dramatic dispersion in growth rates is more dramatic than patterns in average or even median growth rates
- Some angel groups have been very successful in growing both their investment and their membership during this period of instability in the funding environment
AUTHOR: John Harbison, Chair Emeritus of TCA Venture Group and ACA Data Analytics Committee Chair